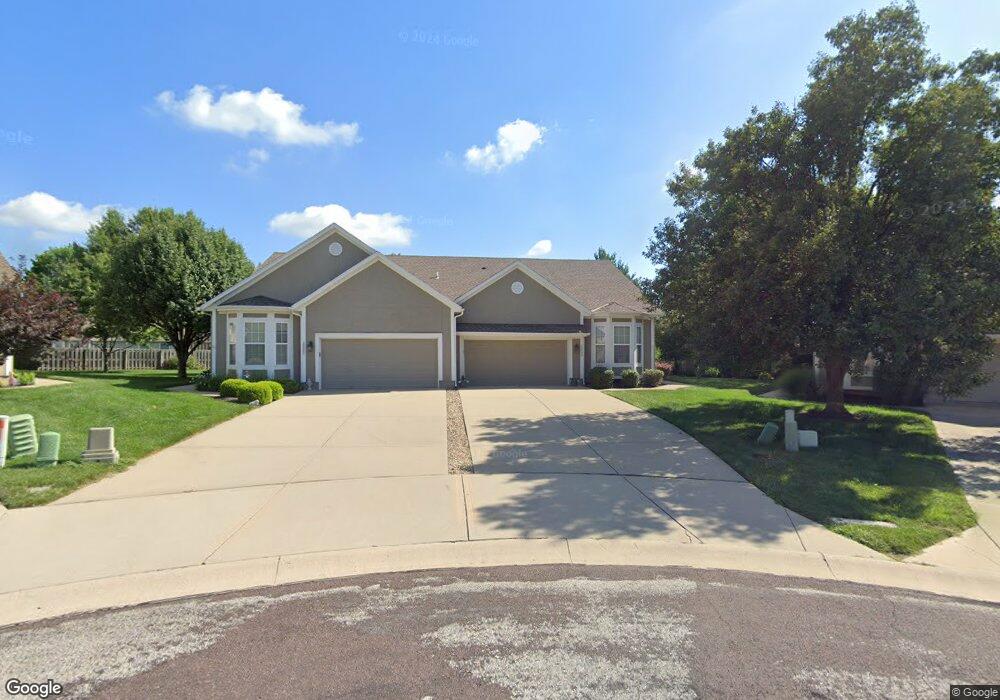
15559 Floyd Ln Overland Park, KS 66223
South Overland Park NeighborhoodEstimated Value: $362,000 - $389,507
3
Beds
3
Baths
1,311
Sq Ft
$283/Sq Ft
Est. Value
About This Home
This home is located at 15559 Floyd Ln, Overland Park, KS 66223 and is currently estimated at $370,627, approximately $282 per square foot. 15559 Floyd Ln is a home located in Johnson County with nearby schools including Blue River Elementary School, Blue Valley Middle School, and Blue Valley High School.
Ownership History
Date
Name
Owned For
Owner Type
Purchase Details
Closed on
Feb 24, 2020
Sold by
Okeefe Michael P and Okeefe Donna L
Bought by
Ngo Don and Hoang Mary
Current Estimated Value
Home Financials for this Owner
Home Financials are based on the most recent Mortgage that was taken out on this home.
Original Mortgage
$198,750
Outstanding Balance
$176,354
Interest Rate
3.6%
Mortgage Type
New Conventional
Estimated Equity
$194,273
Purchase Details
Closed on
Jul 14, 2016
Sold by
Keefe Jayne O and Keefe Patrick F O
Bought by
Keefe Donna L O and Keefe Michael P O
Purchase Details
Closed on
May 12, 2004
Sold by
Wiley Enterprises Llc
Bought by
Okeefe Patrick F
Home Financials for this Owner
Home Financials are based on the most recent Mortgage that was taken out on this home.
Original Mortgage
$144,219
Interest Rate
3.62%
Mortgage Type
Purchase Money Mortgage
Create a Home Valuation Report for This Property
The Home Valuation Report is an in-depth analysis detailing your home's value as well as a comparison with similar homes in the area
Home Values in the Area
Average Home Value in this Area
Purchase History
| Date | Buyer | Sale Price | Title Company |
|---|---|---|---|
| Ngo Don | -- | Stewart Title Company | |
| Keefe Donna L O | -- | None Available | |
| Okeefe Patrick F | -- | Security Land Title Company |
Source: Public Records
Mortgage History
| Date | Status | Borrower | Loan Amount |
|---|---|---|---|
| Open | Ngo Don | $198,750 | |
| Previous Owner | Okeefe Patrick F | $144,219 |
Source: Public Records
Tax History Compared to Growth
Tax History
| Year | Tax Paid | Tax Assessment Tax Assessment Total Assessment is a certain percentage of the fair market value that is determined by local assessors to be the total taxable value of land and additions on the property. | Land | Improvement |
|---|---|---|---|---|
| 2024 | $4,126 | $40,652 | $5,024 | $35,628 |
| 2023 | $4,017 | $38,720 | $5,024 | $33,696 |
| 2022 | $3,668 | $34,753 | $5,024 | $29,729 |
| 2021 | $3,345 | $29,969 | $4,370 | $25,599 |
| 2020 | $3,175 | $28,267 | $3,497 | $24,770 |
| 2019 | $3,245 | $28,278 | $2,332 | $25,946 |
| 2018 | $2,805 | $23,977 | $2,331 | $21,646 |
| 2017 | $2,677 | $22,494 | $2,331 | $20,163 |
| 2016 | $2,578 | $21,643 | $2,331 | $19,312 |
| 2015 | $2,420 | $20,263 | $2,331 | $17,932 |
| 2013 | -- | $20,113 | $2,331 | $17,782 |
Source: Public Records
Map
Nearby Homes
- 15530 Marty St
- 15715 Travis St
- 15607 Conser St
- 15416 Floyd St
- 15612 Barkley St
- 6301 W 158th Place
- 15212 Riley St
- 6115 W 157th St
- 7842 W 156th Place
- 7862 W 158th Ct
- 7863 W 158th St
- 7907 W 154th St
- 7905 W 155th Place
- 15021 Broadmoor St
- 7903 W 156th Terrace
- 6930 W 162nd Ct
- 15090 Walmer St
- 15200 Dearborn St
- 14927 Riggs St
- 15508 Outlook St