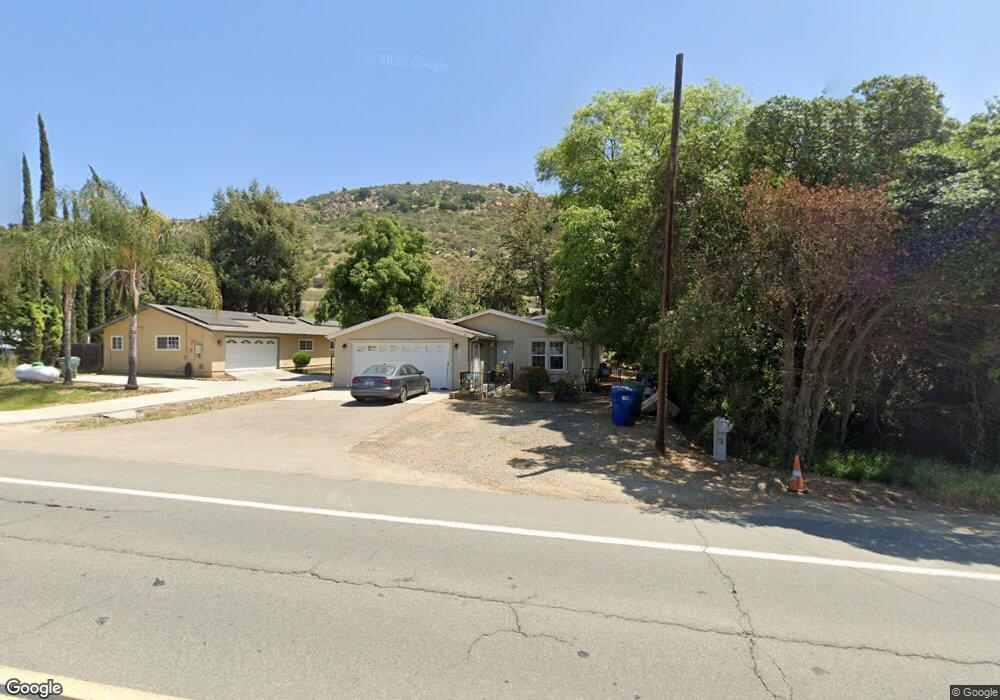
15559 Olde Highway 80 El Cajon, CA 92021
Blossom Valley NeighborhoodEstimated Value: $855,000 - $1,002,000
3
Beds
2
Baths
1,998
Sq Ft
$463/Sq Ft
Est. Value
About This Home
This home is located at 15559 Olde Highway 80, El Cajon, CA 92021 and is currently estimated at $924,947, approximately $462 per square foot. 15559 Olde Highway 80 is a home located in San Diego County with nearby schools including Blossom Valley Elementary School, Los Coches Creek Middle School, and El Capitan High School.
Ownership History
Date
Name
Owned For
Owner Type
Purchase Details
Closed on
Apr 16, 2012
Sold by
Phillips Carol E and Jackson Bryan E
Bought by
Ochoa Raymie N and Ochoa Stephanie A
Current Estimated Value
Home Financials for this Owner
Home Financials are based on the most recent Mortgage that was taken out on this home.
Original Mortgage
$310,000
Outstanding Balance
$213,513
Interest Rate
3.85%
Mortgage Type
VA
Estimated Equity
$711,434
Purchase Details
Closed on
Feb 20, 2007
Sold by
Jackson Evelyn M
Bought by
Jackson Evelyn M
Purchase Details
Closed on
Nov 30, 2004
Sold by
Fitzgerald Stephen and Fitzgerald Denise
Bought by
Jackson Evelyn M
Home Financials for this Owner
Home Financials are based on the most recent Mortgage that was taken out on this home.
Original Mortgage
$180,000
Interest Rate
5.8%
Mortgage Type
Unknown
Purchase Details
Closed on
Mar 25, 2004
Sold by
Saenz Mary E
Bought by
Fitzgerald Stephen and Fitzgerald Denise
Create a Home Valuation Report for This Property
The Home Valuation Report is an in-depth analysis detailing your home's value as well as a comparison with similar homes in the area
Home Values in the Area
Average Home Value in this Area
Purchase History
| Date | Buyer | Sale Price | Title Company |
|---|---|---|---|
| Ochoa Raymie N | $310,000 | Lawyers Title | |
| Jackson Evelyn M | -- | None Available | |
| Jackson Evelyn M | -- | None Available | |
| Jackson Evelyn M | $180,000 | New Century Title Company | |
| Fitzgerald Stephen | -- | -- |
Source: Public Records
Mortgage History
| Date | Status | Borrower | Loan Amount |
|---|---|---|---|
| Open | Ochoa Raymie N | $310,000 | |
| Previous Owner | Jackson Evelyn M | $180,000 |
Source: Public Records
Tax History Compared to Growth
Tax History
| Year | Tax Paid | Tax Assessment Tax Assessment Total Assessment is a certain percentage of the fair market value that is determined by local assessors to be the total taxable value of land and additions on the property. | Land | Improvement |
|---|---|---|---|---|
| 2025 | $2,694 | $389,365 | $138,159 | $251,206 |
| 2024 | $2,694 | $381,731 | $135,450 | $246,281 |
| 2023 | $2,687 | $374,247 | $132,795 | $241,452 |
| 2022 | $4,537 | $366,910 | $130,192 | $236,718 |
| 2021 | $4,473 | $359,717 | $127,640 | $232,077 |
| 2020 | $4,424 | $356,030 | $126,332 | $229,698 |
| 2019 | $2,675 | $349,050 | $123,855 | $225,195 |
| 2018 | $4,298 | $342,207 | $121,427 | $220,780 |
| 2017 | $4,243 | $335,498 | $119,047 | $216,451 |
| 2016 | $4,076 | $328,920 | $116,713 | $212,207 |
| 2015 | $4,055 | $323,980 | $114,960 | $209,020 |
| 2014 | $3,977 | $317,635 | $112,709 | $204,926 |
Source: Public Records
Map
Nearby Homes
- 15613 Hawley Ct
- 15420 Olde Highway 80 Unit SPC 44
- 15420 Olde Highway 80 Unit 218
- 15420 Olde Highway 80 Unit 12
- 15786 Olde Highway 80
- 15935 Spring Oaks Rd Unit 112
- 15935 Spring Oaks Rd Unit 38
- 15935 Spring Oaks Rd Unit 72
- 14930 Shanteau Dr Unit 57
- 5102 Espinoza Rd
- 10328 Hawley Rd
- 10001 Dunbar Ln Unit 20
- 0 Chocolate Creek Rd
- 15718 Creek Hills Rd
- 301 Arnold Way
- 9410 Brian Way
- 15068 Creek Hills Rd
- 0 Quail Canyon Rd
- 9494 Chimney Rock Ln
- 510 Alpine Blvd Unit 1
- 15547 Olde Highway 80
- 15560 Highway 8 Business
- 15535 Olde Highway 80
- 15568 Highway 8 Business
- 15568 Olde Highway 80
- 15542 Highway 8 E
- 15542 Olde Highway 80
- 15525 Olde Highway 80
- 15532 Olde Highway 80
- 15593 Olde Highway 80
- 15518 Highway 8 Business
- 15505 Olde Highway 80
- 15506 Olde Highway 80
- 15506 Olde Highway 80
- 15472 Olde Highway 80
- 15495 Olde Highway 80
- 9669 Carta Ln
- 15455 Olde Highway 80
- 9820 Hawley Rd
- 9723 Hawley Rd