Estimated Value: $245,000 - $257,000
3
Beds
2
Baths
1,176
Sq Ft
$214/Sq Ft
Est. Value
About This Home
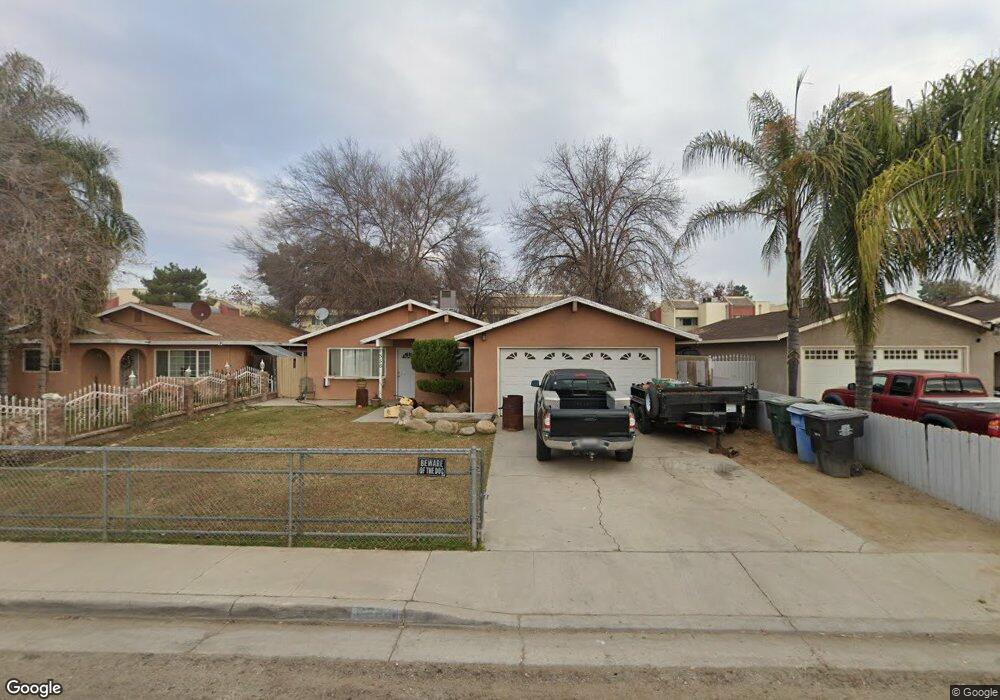
This home is located at 1556 Shane Ct, Arvin, CA 93203 and is currently estimated at $251,558, approximately $213 per square foot. 1556 Shane Ct is a home located in Kern County with nearby schools including Bear Mountain Elementary School, Haven Drive Middle School, and Arvin High School.
Ownership History
Date
Name
Owned For
Owner Type
Purchase Details
Closed on
Nov 9, 2011
Sold by
Morales Manuel and Morales Eva
Bought by
Mohamed Yolanda
Current Estimated Value
Purchase Details
Closed on
Mar 29, 2005
Sold by
Morales Rogelio and Morales Ana
Bought by
Morales Manuel and Morales Eva
Home Financials for this Owner
Home Financials are based on the most recent Mortgage that was taken out on this home.
Original Mortgage
$130,500
Interest Rate
5.92%
Mortgage Type
Fannie Mae Freddie Mac
Purchase Details
Closed on
Feb 28, 1996
Sold by
Watson Richard Earl and Richard Earl Watson Living Tru
Bought by
Morales Rogelio and Morales Ana B
Home Financials for this Owner
Home Financials are based on the most recent Mortgage that was taken out on this home.
Original Mortgage
$62,550
Interest Rate
7.34%
Create a Home Valuation Report for This Property
The Home Valuation Report is an in-depth analysis detailing your home's value as well as a comparison with similar homes in the area
Home Values in the Area
Average Home Value in this Area
Purchase History
| Date | Buyer | Sale Price | Title Company |
|---|---|---|---|
| Mohamed Yolanda | $75,000 | Chicago Title Company | |
| Morales Manuel | $145,000 | Ticor Title | |
| Morales Rogelio | $69,500 | Nations Title |
Source: Public Records
Mortgage History
| Date | Status | Borrower | Loan Amount |
|---|---|---|---|
| Previous Owner | Morales Manuel | $130,500 | |
| Previous Owner | Morales Rogelio | $62,550 |
Source: Public Records
Tax History Compared to Growth
Tax History
| Year | Tax Paid | Tax Assessment Tax Assessment Total Assessment is a certain percentage of the fair market value that is determined by local assessors to be the total taxable value of land and additions on the property. | Land | Improvement |
|---|---|---|---|---|
| 2025 | $2,162 | $87,911 | $37,676 | $50,235 |
| 2024 | $2,063 | $86,188 | $36,938 | $49,250 |
| 2023 | $2,063 | $84,499 | $36,214 | $48,285 |
| 2022 | $2,009 | $82,843 | $35,504 | $47,339 |
| 2021 | $1,921 | $81,219 | $34,808 | $46,411 |
| 2020 | $1,884 | $80,388 | $34,452 | $45,936 |
| 2019 | $1,863 | $80,388 | $34,452 | $45,936 |
| 2018 | $1,818 | $77,268 | $33,115 | $44,153 |
| 2017 | $1,760 | $75,754 | $32,466 | $43,288 |
| 2016 | $1,673 | $74,270 | $31,830 | $42,440 |
| 2015 | $1,618 | $73,155 | $31,352 | $41,803 |
| 2014 | $1,566 | $71,723 | $30,738 | $40,985 |
Source: Public Records
Map
Nearby Homes
- 698 S Comanche Dr
- 1348 Haven Dr
- 1200 Royal St
- 0 S Comanche Dr
- 1777 S Comanche Dr
- 801 Schipper St Unit 31
- 801 Schipper St Unit 45
- 801 Schipper St Unit 30
- 801 Schipper St Unit 20
- 801 Schipper St Unit 65
- 398 Capistrano St
- 200 5th Ave Unit 32
- 0 E Bear Mountain Blvd
- 828 Stockton Ave
- 795 S Derby St
- 1708 Payne Dr
- 931 S Derby St
- 0 Tejon Hwy
- 14141 Comanche Dr
- 1205 Serinidad Way