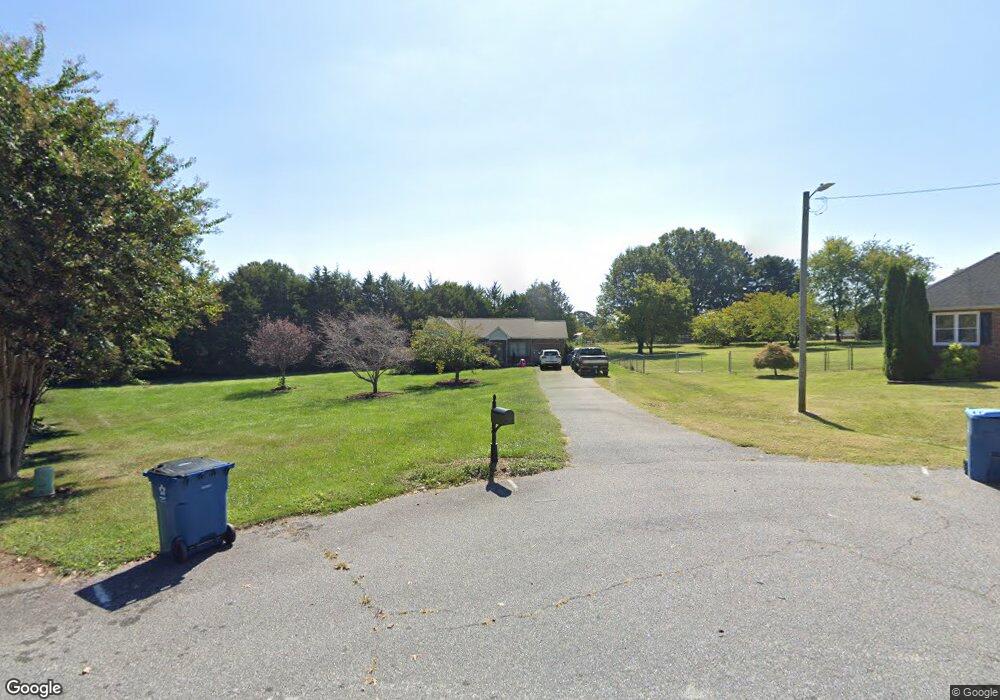
1557 Carriage Ct Conover, NC 28613
Estimated Value: $235,744 - $253,000
3
Beds
2
Baths
1,110
Sq Ft
$221/Sq Ft
Est. Value
About This Home
This home is located at 1557 Carriage Ct, Conover, NC 28613 and is currently estimated at $245,186, approximately $220 per square foot. 1557 Carriage Ct is a home located in Catawba County with nearby schools including Lyle Creek Elementary School, River Bend Middle School, and Bunker Hill High School.
Ownership History
Date
Name
Owned For
Owner Type
Purchase Details
Closed on
Feb 16, 2021
Sold by
Stephens Chad Anthony and Stephens Ashley J
Bought by
Mann Jacob Anthony
Current Estimated Value
Home Financials for this Owner
Home Financials are based on the most recent Mortgage that was taken out on this home.
Original Mortgage
$147,283
Outstanding Balance
$131,614
Interest Rate
2.65%
Mortgage Type
FHA
Estimated Equity
$113,572
Purchase Details
Closed on
Jun 21, 2006
Sold by
Smith Thomas L and Smith Claire L
Bought by
Stephens Chad Anthony
Home Financials for this Owner
Home Financials are based on the most recent Mortgage that was taken out on this home.
Original Mortgage
$99,860
Interest Rate
6.49%
Mortgage Type
Purchase Money Mortgage
Purchase Details
Closed on
Sep 1, 1996
Bought by
Smith Thomas L and Smith Claire L
Create a Home Valuation Report for This Property
The Home Valuation Report is an in-depth analysis detailing your home's value as well as a comparison with similar homes in the area
Home Values in the Area
Average Home Value in this Area
Purchase History
| Date | Buyer | Sale Price | Title Company |
|---|---|---|---|
| Mann Jacob Anthony | $150,000 | None Available | |
| Mann Jacob Anthony | $150,000 | None Listed On Document | |
| Stephens Chad Anthony | $109,000 | None Available | |
| Smith Thomas L | $80,000 | -- |
Source: Public Records
Mortgage History
| Date | Status | Borrower | Loan Amount |
|---|---|---|---|
| Open | Mann Jacob Anthony | $147,283 | |
| Closed | Mann Jacob Anthony | $147,283 | |
| Previous Owner | Stephens Chad Anthony | $99,860 |
Source: Public Records
Tax History
| Year | Tax Paid | Tax Assessment Tax Assessment Total Assessment is a certain percentage of the fair market value that is determined by local assessors to be the total taxable value of land and additions on the property. | Land | Improvement |
|---|---|---|---|---|
| 2025 | $1,069 | $204,500 | $23,400 | $181,100 |
| 2024 | $1,069 | $204,500 | $23,400 | $181,100 |
| 2023 | $1,028 | $125,900 | $16,100 | $109,800 |
| 2022 | $875 | $125,900 | $16,100 | $109,800 |
| 2021 | $875 | $125,900 | $16,100 | $109,800 |
| 2020 | $875 | $125,900 | $16,100 | $109,800 |
| 2019 | $875 | $125,900 | $0 | $0 |
| 2018 | $770 | $110,800 | $15,700 | $95,100 |
| 2017 | $770 | $0 | $0 | $0 |
| 2016 | $770 | $0 | $0 | $0 |
| 2015 | $605 | $110,800 | $15,700 | $95,100 |
| 2014 | $605 | $100,800 | $15,700 | $85,100 |
Source: Public Records
Map
Nearby Homes
- 5217 Canterbury Dr
- 4484 Springs Rd
- 5505 Creek Point Dr
- 5429 Buddy St Unit LOT 3
- 1098 Remington Dr
- 4687 Ransom Dr
- 1246 Houston Mill Rd
- 1113 Pecan St
- 3646 46th Ave NE
- 3835 Sulphur Springs Rd NE
- 3635 46th Ave NE
- 3321 39th Avenue Ct NE Unit 5
- 1158 Sunset Ct
- 4852 Brookridge Dr NE
- 4874 Stone Dr Unit 125
- 5005 Woodwinds Dr NE
- 3845 Steve Ikerd Dr NE
- 4645 Rifle Range Rd
- 3361 47th Avenue Place NE Unit 76
- 1371 Millrace Dr
- 1563 Carriage Ct
- 4297 Springs Rd
- 1558 Carriage Ct
- 1560 Carriage Ct
- 5208 Canterbury Dr
- 5221 Glory St
- 5196 Canterbury Dr
- 1572 Carriage Ct
- 4283 Springs Rd
- 5186 Canterbury Dr
- 1584 Carriage Ct
- 4273 Springs Rd
- 5174 Canterbury Dr
- 5162 Canterbury Dr
- 5232 Canterbury Dr
- 4300 Springs Rd
- 5209 Canterbury Dr
- 5197 Canterbury Dr
- 5150 Canterbury Dr
- 5189 Canterbury Dr
Your Personal Tour Guide
Ask me questions while you tour the home.