15572 S Siskiyou Loop Corning, CA 96021
Estimated Value: $70,000 - $83,000
Studio
--
Bath
--
Sq Ft
71,003
Sq Ft Lot
About This Home
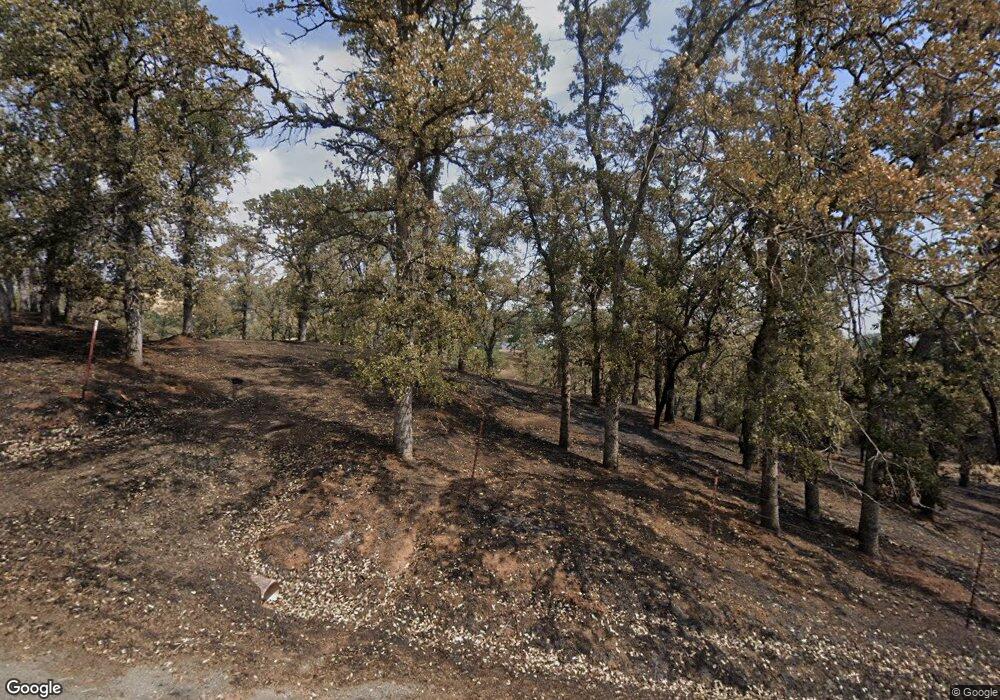
This home is located at 15572 S Siskiyou Loop, Corning, CA 96021 and is currently estimated at $75,589. 15572 S Siskiyou Loop is a home located in Tehama County with nearby schools including Rancho Tehama Elementary School, Maywood Middle School, and Corning High School.
Ownership History
Date
Name
Owned For
Owner Type
Purchase Details
Closed on
Jul 13, 2010
Sold by
Zarecky Barry and Zarecky Barbara
Bought by
Thomas George A and Thomas Cecily K
Current Estimated Value
Purchase Details
Closed on
Apr 12, 2010
Sold by
Rtr
Bought by
Thomas George A and Thomas Cecily K
Purchase Details
Closed on
Aug 23, 2007
Sold by
Zarecky Barry and Zarecky Barbara
Bought by
Rtr
Purchase Details
Closed on
Oct 31, 2006
Sold by
Eagles Nest Investments Inc
Bought by
Zarecky Barry and Zarecky Barbara
Home Financials for this Owner
Home Financials are based on the most recent Mortgage that was taken out on this home.
Original Mortgage
$155,000
Interest Rate
6.3%
Mortgage Type
Unknown
Purchase Details
Closed on
Aug 30, 2006
Sold by
Lauer Norma J
Bought by
Eagles Nest Investments Inc
Purchase Details
Closed on
May 13, 2003
Sold by
Lynch Hiro
Bought by
Dunton Frank
Create a Home Valuation Report for This Property
The Home Valuation Report is an in-depth analysis detailing your home's value as well as a comparison with similar homes in the area
Purchase History
| Date | Buyer | Sale Price | Title Company |
|---|---|---|---|
| Thomas George A | $157,713 | First American Title Ins Co | |
| Thomas George A | -- | None Available | |
| Rtr | -- | None Available | |
| Zarecky Barry | $60,000 | Northern California Title Co | |
| Eagles Nest Investments Inc | $55,000 | Northern California Title Co | |
| Dunton Frank | $9,500 | Chicago Title Co | |
| Lynch Hiro | -- | Chicago Title Co |
Source: Public Records
Mortgage History
| Date | Status | Borrower | Loan Amount |
|---|---|---|---|
| Previous Owner | Zarecky Barry | $155,000 |
Source: Public Records
Tax History
| Year | Tax Paid | Tax Assessment Tax Assessment Total Assessment is a certain percentage of the fair market value that is determined by local assessors to be the total taxable value of land and additions on the property. | Land | Improvement |
|---|---|---|---|---|
| 2025 | $275 | $26,431 | $13,155 | $13,276 |
| 2023 | $270 | $25,407 | $12,646 | $12,761 |
| 2022 | $266 | $24,910 | $12,399 | $12,511 |
| 2021 | $256 | $24,375 | $11,832 | $12,543 |
| 2020 | $258 | $24,126 | $11,711 | $12,415 |
| 2019 | $248 | $23,654 | $11,482 | $12,172 |
| 2018 | $248 | $23,191 | $11,257 | $11,934 |
| 2017 | $247 | $22,737 | $11,037 | $11,700 |
| 2016 | $230 | $22,292 | $10,821 | $11,471 |
| 2015 | -- | $21,958 | $10,659 | $11,299 |
| 2014 | $225 | $21,529 | $10,451 | $11,078 |
Source: Public Records
Map
Nearby Homes
- 15740 Rancho Tehama Rd
- 15773 El Dorado Dr
- 15530 Rancho Tehama Rd
- 15838 El Dorado Dr
- 7203 Amador Ct
- 15782 Stagecoach Rd
- 7198 Amador Ct
- 7198 Amador Ct Unit 455
- 15753 / 15743 Pine Needle Ct Unit Lots 604 / 641
- 7455 Humboldt Dr
- 15785 Placer Ct
- 15743 Pine Needle Ct
- 7074 Sugar Pine Ct
- 15828 El Dorado Dr
- 7247 Pinecone Ct
- 7636 Mono Ct
- 15565 N Mendocino Dr Unit Lot 346
- 15565 N Mendocino Dr
- 15942 S Mendocino Dr Unit Lot 247
- 15942 S Mendocino Dr
- 15582 S Siskiyou Loop
- 7274 Alpine Dr
- 15567 N Siskiyou Loop
- 15617 S Siskiyou Loop
- 7280 Humboldt Dr
- 7264 Alpine Dr
- 15584 N Siskiyou Loop
- 15562 S Siskiyou Loop
- 15614 N Siskiyou Loop
- 15522 S Siskiyou Loop
- 15517 S Siskiyou Loop Unit 15527 South Siskiyou
- 15614 North St
- 7260 Humboldt Dr Unit Lot 156-2
- 7260 Humboldt Dr
- 15624 S Siskiyou Loop
- 15660 Rancho Tehama Rd
- 15800 Rancho Tehama Rd
- 15760 Rancho Tehama Rd
- 16040 Rancho Tehama Rd
- 7305 Humboldt Dr
Your Personal Tour Guide
Ask me questions while you tour the home.