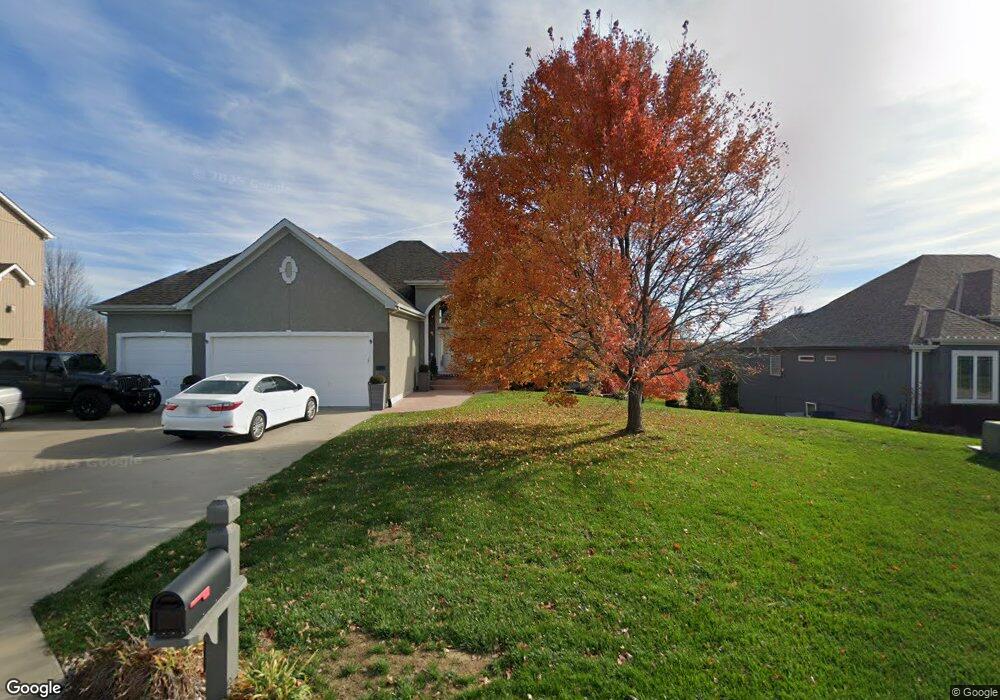
15575 NW 126th St Platte City, MO 64079
Estimated Value: $323,320 - $354,000
3
Beds
3
Baths
1,348
Sq Ft
$253/Sq Ft
Est. Value
About This Home
This home is located at 15575 NW 126th St, Platte City, MO 64079 and is currently estimated at $341,080, approximately $253 per square foot. 15575 NW 126th St is a home located in Platte County with nearby schools including Platte County High School.
Ownership History
Date
Name
Owned For
Owner Type
Purchase Details
Closed on
Oct 18, 2021
Sold by
Kittling Sylvester O and Kittling Yvonne B
Bought by
Kittling Donnell
Current Estimated Value
Home Financials for this Owner
Home Financials are based on the most recent Mortgage that was taken out on this home.
Original Mortgage
$160,050
Outstanding Balance
$146,474
Interest Rate
3.05%
Mortgage Type
New Conventional
Estimated Equity
$194,606
Purchase Details
Closed on
Feb 29, 2016
Sold by
Kittling Sylvester O and Baldago Yvonne
Bought by
Kittling Sylvester O
Home Financials for this Owner
Home Financials are based on the most recent Mortgage that was taken out on this home.
Original Mortgage
$135,522
Interest Rate
3.72%
Mortgage Type
VA
Purchase Details
Closed on
Mar 14, 2007
Sold by
Wright Janice Nadine
Bought by
Kittling Sylvester O
Home Financials for this Owner
Home Financials are based on the most recent Mortgage that was taken out on this home.
Original Mortgage
$171,726
Interest Rate
6.3%
Mortgage Type
VA
Create a Home Valuation Report for This Property
The Home Valuation Report is an in-depth analysis detailing your home's value as well as a comparison with similar homes in the area
Home Values in the Area
Average Home Value in this Area
Purchase History
| Date | Buyer | Sale Price | Title Company |
|---|---|---|---|
| Kittling Donnell | -- | Security 1St Title Llc | |
| Kittling Sylvester O | -- | Linear Title & Closing | |
| Kittling Sylvester O | -- | None Available |
Source: Public Records
Mortgage History
| Date | Status | Borrower | Loan Amount |
|---|---|---|---|
| Open | Kittling Donnell | $160,050 | |
| Closed | Kittling Sylvester O | $135,522 | |
| Previous Owner | Kittling Sylvester O | $171,726 |
Source: Public Records
Tax History Compared to Growth
Tax History
| Year | Tax Paid | Tax Assessment Tax Assessment Total Assessment is a certain percentage of the fair market value that is determined by local assessors to be the total taxable value of land and additions on the property. | Land | Improvement |
|---|---|---|---|---|
| 2024 | $2,879 | $43,285 | $9,796 | $33,489 |
| 2023 | $2,879 | $43,285 | $9,796 | $33,489 |
| 2022 | $2,585 | $38,510 | $9,796 | $28,714 |
| 2021 | $2,592 | $38,510 | $9,796 | $28,714 |
| 2020 | $2,327 | $34,170 | $7,165 | $27,005 |
| 2019 | $2,327 | $34,170 | $7,165 | $27,005 |
| 2018 | $1,847 | $26,899 | $5,605 | $21,294 |
| 2017 | $1,837 | $26,899 | $5,605 | $21,294 |
| 2016 | $1,822 | $26,899 | $5,605 | $21,294 |
| 2015 | $1,821 | $26,899 | $5,605 | $21,294 |
| 2013 | $1,669 | $26,899 | $0 | $0 |
Source: Public Records
Map
Nearby Homes
- 15565 NW 127th St
- 15870 NW 126th Terrace
- 15850 NW 125th St
- 12530 NW Riley Ct
- Cardinale Plan at Running Horse
- Calistoga Plan at Running Horse
- Inglenook Plan at Running Horse
- Monterey Plan at Running Horse
- Delano Plan at Running Horse
- Windsor Plan at Running Horse
- Fairfield Plan at Running Horse
- Glenwood Plan at Running Horse
- Sonoma Plan at Running Horse
- 16045 NW 124th St
- 15367 NW 123rd St
- 13060 Woodridge St
- 12445 NW Appaloosa St
- 16410 NW 123rd St
- 16430 NW 123rd St
- 12435 Appaloosa St
- 15555 NW 126th St
- 12630 Oak Point Dr
- 15525 NW 126th St
- 15570 NW 126th St
- 15560 NW 126th St
- 12600 Oak Point Dr
- 15550 NW 126th St
- 15530 NW 126th St
- 12590 Oak Point Dr
- 15495 NW 126th St
- 15500 NW 126th St
- 12615 Oak Point Dr
- 15490 NW 126th St
- 15475 NW 126th St
- 12570 Oak Point Dr
- 12610 Oak Lane Cir
- 15470 NW 126th St
- 12620 Oak Lane Cir
- 12565 Oak Point Dr
- 15455 NW 126th St