Estimated Value: $522,000 - $557,000
5
Beds
3
Baths
2,903
Sq Ft
$184/Sq Ft
Est. Value
About This Home
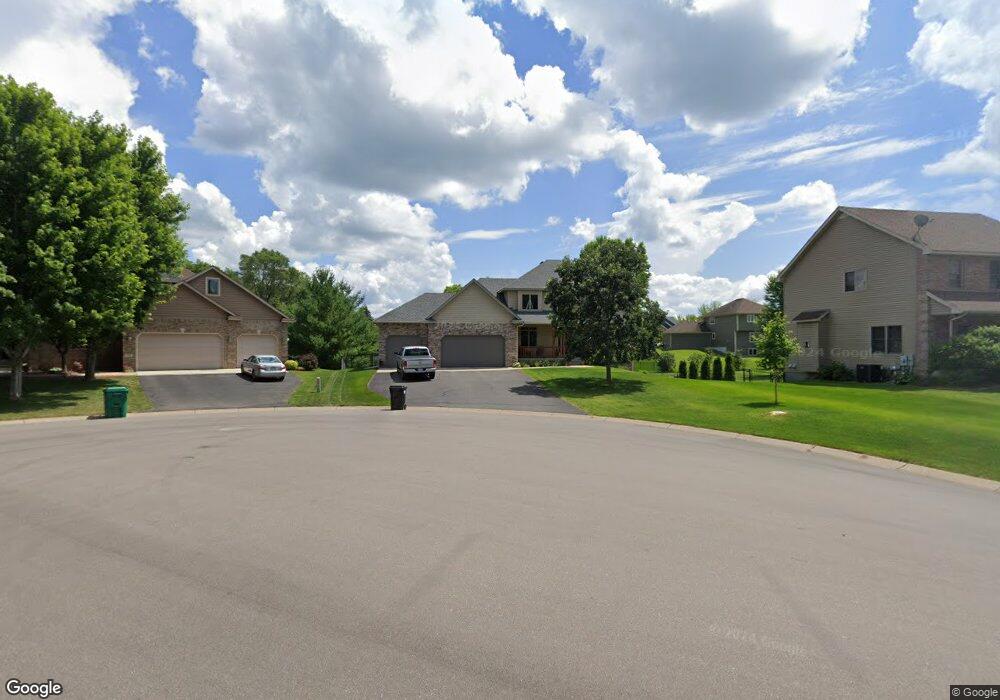
This home is located at 15575 Xkimo Ct NW, Anoka, MN 55303 and is currently estimated at $534,189, approximately $184 per square foot. 15575 Xkimo Ct NW is a home located in Anoka County with nearby schools including Brookside Elementary School, Anoka Middle School for the Arts - Fred Moor Campus, and Anoka Senior High School.
Ownership History
Date
Name
Owned For
Owner Type
Purchase Details
Closed on
Sep 14, 2018
Sold by
Mork Nathan P and Mork Nathan Paul
Bought by
Turnbom Brianna C
Current Estimated Value
Home Financials for this Owner
Home Financials are based on the most recent Mortgage that was taken out on this home.
Original Mortgage
$337,410
Outstanding Balance
$293,635
Interest Rate
4.5%
Mortgage Type
New Conventional
Estimated Equity
$240,554
Purchase Details
Closed on
Aug 12, 2013
Sold by
Schrupp Charise Ann and Mork Charise Ann Schrupp
Bought by
Mork Nathan Paul
Purchase Details
Closed on
Jul 14, 2005
Sold by
C & M Custom Home Builders Inc
Bought by
Mork Charise and Mork Nathan P
Home Financials for this Owner
Home Financials are based on the most recent Mortgage that was taken out on this home.
Original Mortgage
$310,600
Interest Rate
4.87%
Mortgage Type
New Conventional
Create a Home Valuation Report for This Property
The Home Valuation Report is an in-depth analysis detailing your home's value as well as a comparison with similar homes in the area
Home Values in the Area
Average Home Value in this Area
Purchase History
| Date | Buyer | Sale Price | Title Company |
|---|---|---|---|
| Turnbom Brianna C | $38,536 | Liberty Title Inc | |
| Mork Nathan Paul | -- | None Available | |
| Mork Charise | $390,000 | -- |
Source: Public Records
Mortgage History
| Date | Status | Borrower | Loan Amount |
|---|---|---|---|
| Open | Turnbom Brianna C | $337,410 | |
| Previous Owner | Mork Charise | $310,600 |
Source: Public Records
Tax History Compared to Growth
Tax History
| Year | Tax Paid | Tax Assessment Tax Assessment Total Assessment is a certain percentage of the fair market value that is determined by local assessors to be the total taxable value of land and additions on the property. | Land | Improvement |
|---|---|---|---|---|
| 2025 | $5,520 | $507,600 | $88,000 | $419,600 |
| 2024 | $5,520 | $487,400 | $81,900 | $405,500 |
| 2023 | $4,912 | $476,500 | $78,000 | $398,500 |
| 2022 | $4,573 | $473,200 | $65,200 | $408,000 |
| 2021 | $4,302 | $396,800 | $54,000 | $342,800 |
| 2020 | $4,287 | $375,100 | $51,000 | $324,100 |
| 2019 | $4,102 | $362,700 | $51,000 | $311,700 |
| 2018 | $4,956 | $338,900 | $0 | $0 |
| 2017 | $4,237 | $335,500 | $0 | $0 |
| 2016 | $3,945 | $299,100 | $0 | $0 |
| 2015 | -- | $299,100 | $49,000 | $250,100 |
| 2014 | -- | $255,400 | $38,000 | $217,400 |
Source: Public Records
Map
Nearby Homes
- 15661 Juniper Ridge Dr NW
- 4680 152nd Ct NW
- 15108 Ute St NW
- 14950 Waco St NW
- 5696 154th Cove NW
- 5658 152nd Ln NW
- 4584 162nd Ln NW
- 16042 Iodine St NW
- 16200 Makah St NW
- 5695 160th Ln NW
- 14860 Makah St NW
- 5641 149th Ln NW
- 16000 Dakota St NW
- 5901 151st Ln NW
- 5803 151st Ln NW
- 5817 151st Ln NW
- 14701 Cobalt St NW Unit 47
- 14661 Cobalt St NW Unit 43
- 14660 Cobalt St NW Unit 12
- 5907 151st Ln NW
- 15565 Xkimo Ct NW
- 15595 Xkimo Ct NW
- 15564 Waco St NW
- 15584 Waco St NW
- 5035 155th Ln NW
- 15554 Waco St NW
- 5045 155th Ln NW
- 15605 Xkimo Ct NW
- 15600 Xkimo Ct NW
- 15582 Xkimo Ct NW
- 15572 Xkimo Ct NW
- 15660 Juniper Ridge Dr NW
- 15562 Xkimo Ct NW
- 15664 Juniper Ridge Dr NW
- 15557 Waco St NW
- 5075 155th Ln NW
- 15541 Xkimo St NW
- 15577 Waco St NW
- 5000 155th Ln NW
- 5020 155th Ln NW