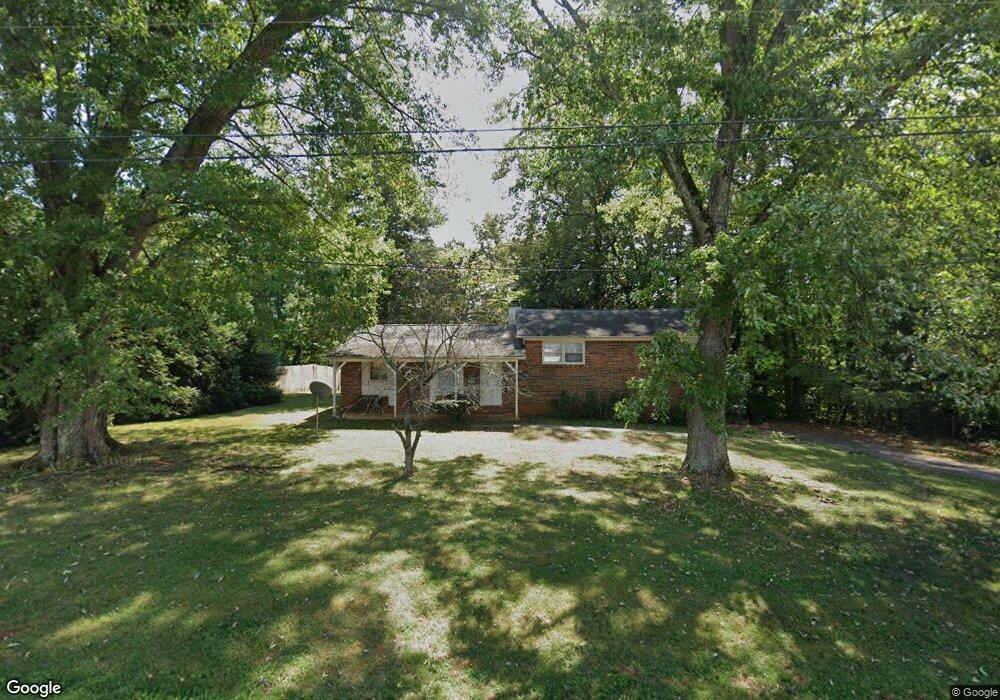
1558 Lake Villa Cir Cookeville, TN 38506
Estimated Value: $229,728 - $356,000
3
Beds
2
Baths
1,539
Sq Ft
$199/Sq Ft
Est. Value
About This Home
This home is located at 1558 Lake Villa Cir, Cookeville, TN 38506 and is currently estimated at $306,932, approximately $199 per square foot. 1558 Lake Villa Cir is a home located in Putnam County with nearby schools including Prescott South Elementary School, Cookeville High School, and Prescott South Middle School.
Ownership History
Date
Name
Owned For
Owner Type
Purchase Details
Closed on
Feb 28, 2008
Sold by
Willene Roberson Addie
Bought by
Dominick Johnny R
Current Estimated Value
Home Financials for this Owner
Home Financials are based on the most recent Mortgage that was taken out on this home.
Original Mortgage
$109,155
Interest Rate
5.63%
Purchase Details
Closed on
Aug 31, 1999
Sold by
Burkett Charleston D
Bought by
Roberson Roy E and Roberson Addie W
Purchase Details
Closed on
Apr 24, 1996
Sold by
Timothy Wade
Bought by
Charleston Burkett and Charleston Lisa
Home Financials for this Owner
Home Financials are based on the most recent Mortgage that was taken out on this home.
Original Mortgage
$77,914
Interest Rate
7.67%
Purchase Details
Closed on
Mar 12, 1990
Bought by
Wade Timothy Brenda
Purchase Details
Closed on
May 4, 1981
Bought by
Pavlovich Lee E
Create a Home Valuation Report for This Property
The Home Valuation Report is an in-depth analysis detailing your home's value as well as a comparison with similar homes in the area
Home Values in the Area
Average Home Value in this Area
Purchase History
| Date | Buyer | Sale Price | Title Company |
|---|---|---|---|
| Dominick Johnny R | $114,900 | -- | |
| Roberson Roy E | $79,000 | -- | |
| Charleston Burkett | $78,000 | -- | |
| Wade Timothy Brenda | $56,200 | -- | |
| Pavlovich Lee E | -- | -- |
Source: Public Records
Mortgage History
| Date | Status | Borrower | Loan Amount |
|---|---|---|---|
| Closed | Pavlovich Lee E | $109,155 | |
| Previous Owner | Pavlovich Lee E | $77,914 |
Source: Public Records
Tax History Compared to Growth
Tax History
| Year | Tax Paid | Tax Assessment Tax Assessment Total Assessment is a certain percentage of the fair market value that is determined by local assessors to be the total taxable value of land and additions on the property. | Land | Improvement |
|---|---|---|---|---|
| 2024 | $1,350 | $37,725 | $5,500 | $32,225 |
| 2023 | $1,350 | $37,725 | $5,500 | $32,225 |
| 2022 | $1,242 | $37,725 | $5,500 | $32,225 |
| 2021 | $1,242 | $37,725 | $5,500 | $32,225 |
| 2020 | $1,069 | $37,725 | $5,500 | $32,225 |
| 2019 | $1,069 | $27,300 | $5,500 | $21,800 |
| 2018 | $974 | $27,300 | $5,500 | $21,800 |
| 2017 | $974 | $27,300 | $5,500 | $21,800 |
| 2016 | $974 | $27,300 | $5,500 | $21,800 |
| 2015 | $1,011 | $27,300 | $5,500 | $21,800 |
| 2014 | $918 | $24,783 | $0 | $0 |
Source: Public Records
Map
Nearby Homes
- 1454 Bradshaw Blvd
- 4536 Old Sparta Rd
- 1757 Bob Bullock Rd
- 4041 Old Sparta Rd
- 1734 Hickory Cove
- 605 Longstreet Dr
- 1130 Cross Pointe Dr
- 615 Ewell Dr
- 643 Ewell Dr
- 966 River Bend Dr
- 1138 Cross Pointe Dr
- 1019 River Bend Dr
- 2375 Hidden Cove Rd
- Lot 14 Stonewall Dr
- Lot 13 Stonewall Dr
- 3766 Old Bridge Rd
- 0 Boyd Farris Rd
- 4548 S Creek Dr
- 1554 Lake Villa Cir
- 1562 Lake Villa Cir
- 1926 Bay View Dr
- 1920 Bay View Dr
- 1557 Lake Villa Cir
- 1553 Lake Villa Cir
- 1564 Lake Villa Cir
- 1550 Lake Villa Cir
- 1932 Bay View Dr
- 1551 Lake Villa Cir
- 1565 Lake Villa Cir
- 1935 Bay View Dr
- 1513 Lake Villa Cir
- 1938 Bay View Dr
- 1546 Lake Villa Cir
- 1566 Lake Villa Cir
- 1549 Lake Villa Cir
- 1515 Lake Villa Cir
- 1517 Lake Villa Cir
- 1511 Lake Villa Cir