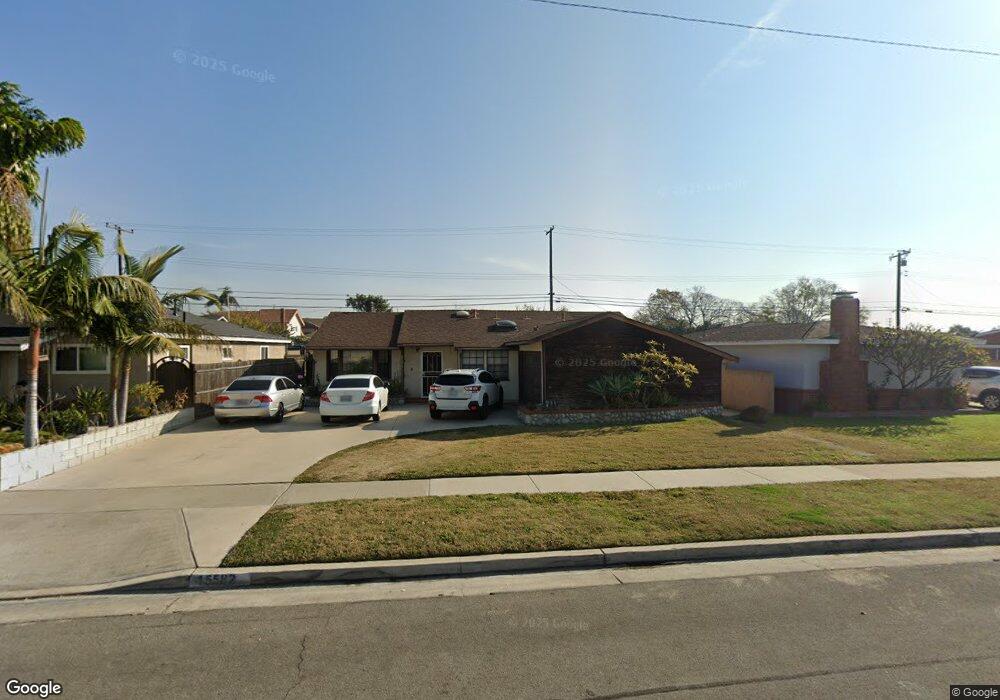
15582 Wilson St Midway City, CA 92655
Estimated Value: $911,000 - $1,073,000
3
Beds
2
Baths
1,253
Sq Ft
$798/Sq Ft
Est. Value
About This Home
This home is located at 15582 Wilson St, Midway City, CA 92655 and is currently estimated at $1,000,519, approximately $798 per square foot. 15582 Wilson St is a home located in Orange County with nearby schools including Star View Elementary, Vista View Middle School, and Ocean View High.
Ownership History
Date
Name
Owned For
Owner Type
Purchase Details
Closed on
Aug 10, 2002
Sold by
Rodriguez Juan and Rodriguez Lisa
Bought by
Nguyen Bachkim T
Current Estimated Value
Home Financials for this Owner
Home Financials are based on the most recent Mortgage that was taken out on this home.
Original Mortgage
$200,000
Interest Rate
6.22%
Purchase Details
Closed on
Aug 7, 2002
Sold by
Tran Johnny Kim
Bought by
Nguyen Bachkim T
Home Financials for this Owner
Home Financials are based on the most recent Mortgage that was taken out on this home.
Original Mortgage
$200,000
Interest Rate
6.22%
Purchase Details
Closed on
Jun 2, 1998
Sold by
Hampton Hampton M and Hampton Regina S
Bought by
Rodriguez Juan and Rodriguez Lisa
Home Financials for this Owner
Home Financials are based on the most recent Mortgage that was taken out on this home.
Original Mortgage
$174,195
Interest Rate
7%
Mortgage Type
FHA
Create a Home Valuation Report for This Property
The Home Valuation Report is an in-depth analysis detailing your home's value as well as a comparison with similar homes in the area
Home Values in the Area
Average Home Value in this Area
Purchase History
| Date | Buyer | Sale Price | Title Company |
|---|---|---|---|
| Nguyen Bachkim T | $320,000 | Commerce Title | |
| Nguyen Bachkim T | -- | Old Republic Title Company | |
| Rodriguez Juan | $187,500 | Fidelity National Title Ins |
Source: Public Records
Mortgage History
| Date | Status | Borrower | Loan Amount |
|---|---|---|---|
| Previous Owner | Nguyen Bachkim T | $200,000 | |
| Previous Owner | Rodriguez Juan | $174,195 |
Source: Public Records
Tax History Compared to Growth
Tax History
| Year | Tax Paid | Tax Assessment Tax Assessment Total Assessment is a certain percentage of the fair market value that is determined by local assessors to be the total taxable value of land and additions on the property. | Land | Improvement |
|---|---|---|---|---|
| 2025 | $5,605 | $463,455 | $365,745 | $97,710 |
| 2024 | $5,605 | $454,368 | $358,573 | $95,795 |
| 2023 | $5,475 | $445,459 | $351,542 | $93,917 |
| 2022 | $5,389 | $436,725 | $344,649 | $92,076 |
| 2021 | $5,273 | $428,162 | $337,891 | $90,271 |
| 2020 | $5,218 | $423,772 | $334,426 | $89,346 |
| 2019 | $5,134 | $415,463 | $327,868 | $87,595 |
| 2018 | $5,025 | $407,317 | $321,439 | $85,878 |
| 2017 | $4,950 | $399,331 | $315,136 | $84,195 |
| 2016 | $4,760 | $391,501 | $308,956 | $82,545 |
| 2015 | $4,692 | $385,621 | $304,315 | $81,306 |
| 2014 | $4,605 | $378,068 | $298,354 | $79,714 |
Source: Public Records
Map
Nearby Homes
- 8252 Mcfadden Ave
- 8331 Gumwood Cir
- 8206 Maureen Dr Unit 16
- 8822 Palos Verdes Ave
- 8200 Bolsa Ave Unit 71
- 8200 Bolsa Ave Unit 42
- 15621 Beach Blvd Unit 108
- 15621 Beach Blvd Unit 28
- 15621 Beach Blvd
- 15621 Beach Blvd Unit 115
- 15621 Beach Blvd Unit 23
- 15621 Beach Blvd Unit 19
- 7911 Rockwell Ave
- 16102 Malaga Ln
- 15081 Van Buren St
- 8961 Emerald Ave
- 15141 Beach Blvd Unit 39
- 15141 Beach Blvd Unit 44
- 7736 Sugar Dr
- 7802 Colgate Ave
- 15572 Wilson St
- 15592 Wilson St
- 15562 Wilson St
- 15602 Wilson St
- 8302 Peters Ave
- 8301 Flight Ave
- 15542 Wilson St
- 15612 Wilson St
- 8282 Peters Ave
- 8281 Flight Ave
- 15592 Sandusky Ln
- 15532 Wilson St
- 15622 Wilson St
- 8301 Peters Ave
- 8272 Peters Ave
- 8271 Flight Ave
- 15582 Sandusky Ln
- 8281 Peters Ave
- 8302 Flight Ave
- 15522 Wilson St