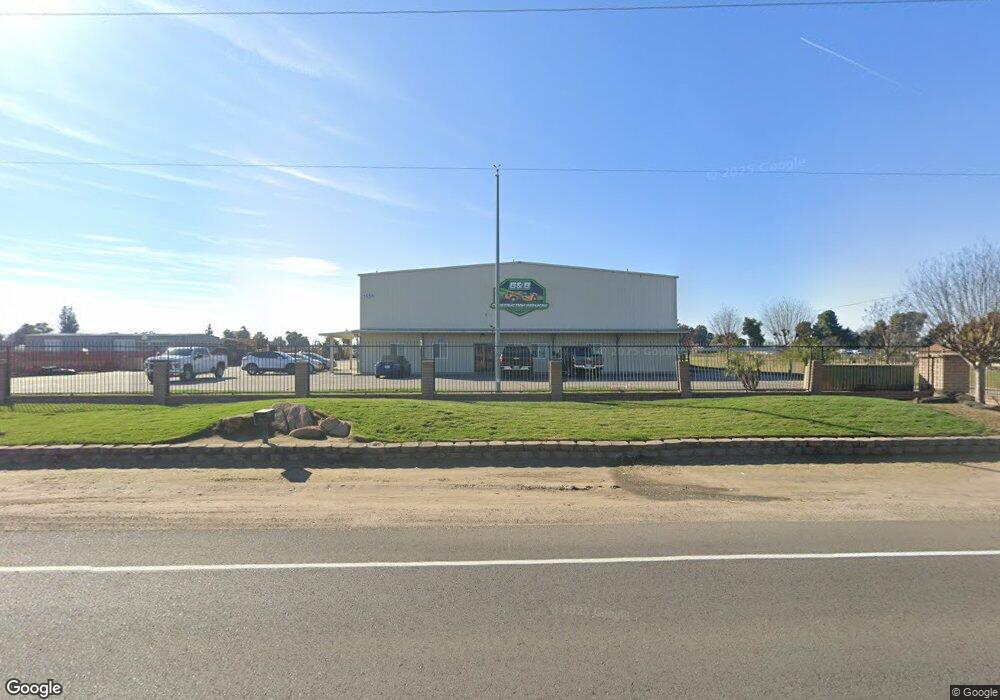
1559 N Mccall Ave Sanger, CA 93657
Estimated Value: $1,280,366
--
Bed
--
Bath
10,288
Sq Ft
$124/Sq Ft
Est. Value
About This Home
This home is located at 1559 N Mccall Ave, Sanger, CA 93657 and is currently estimated at $1,280,366, approximately $124 per square foot. 1559 N Mccall Ave is a home located in Fresno County with nearby schools including Quail Lake Environmental Charter School.
Ownership History
Date
Name
Owned For
Owner Type
Purchase Details
Closed on
Oct 19, 2021
Sold by
Target Land Development Llc
Bought by
Braswell Allan
Current Estimated Value
Purchase Details
Closed on
Aug 4, 2021
Sold by
Braswell Allan
Bought by
Target Land Development Llc
Purchase Details
Closed on
Sep 15, 2015
Sold by
Classic Homes Inc
Bought by
Strickland Kelly and Strickland Monica
Purchase Details
Closed on
Oct 14, 2014
Sold by
Foster James B and Foster Otilia
Bought by
Classic Homes Inc
Purchase Details
Closed on
Sep 25, 2012
Sold by
Westamerica Bank
Bought by
Target Land Development Llc
Home Financials for this Owner
Home Financials are based on the most recent Mortgage that was taken out on this home.
Original Mortgage
$315,000
Interest Rate
3.27%
Mortgage Type
Seller Take Back
Purchase Details
Closed on
Feb 13, 2009
Sold by
Foster James B and Foster Otilia
Bought by
Westamerica Bank
Create a Home Valuation Report for This Property
The Home Valuation Report is an in-depth analysis detailing your home's value as well as a comparison with similar homes in the area
Home Values in the Area
Average Home Value in this Area
Purchase History
| Date | Buyer | Sale Price | Title Company |
|---|---|---|---|
| Braswell Allan | -- | Old Republic Title Company | |
| Target Land Development Llc | -- | None Available | |
| Strickland Kelly | $630,000 | Placer Title Company | |
| Classic Homes Inc | $351,000 | None Available | |
| Target Land Development Llc | $630,000 | Fidelity National Title Co | |
| Westamerica Bank | $672,000 | None Available |
Source: Public Records
Mortgage History
| Date | Status | Borrower | Loan Amount |
|---|---|---|---|
| Previous Owner | Target Land Development Llc | $315,000 |
Source: Public Records
Tax History Compared to Growth
Tax History
| Year | Tax Paid | Tax Assessment Tax Assessment Total Assessment is a certain percentage of the fair market value that is determined by local assessors to be the total taxable value of land and additions on the property. | Land | Improvement |
|---|---|---|---|---|
| 2025 | $9,554 | $775,786 | $153,922 | $621,864 |
| 2023 | $9,364 | $745,663 | $147,946 | $597,717 |
| 2022 | $9,011 | $731,044 | $145,046 | $585,998 |
| 2021 | $8,765 | $716,710 | $142,202 | $574,508 |
| 2020 | $8,731 | $709,362 | $140,744 | $568,618 |
| 2019 | $8,565 | $695,454 | $137,985 | $557,469 |
| 2018 | $8,383 | $681,819 | $135,280 | $546,539 |
| 2017 | $8,243 | $668,451 | $132,628 | $535,823 |
| 2016 | $7,965 | $655,345 | $130,028 | $525,317 |
| 2015 | $7,848 | $645,502 | $128,075 | $517,427 |
| 2014 | $7,709 | $632,859 | $125,567 | $507,292 |
Source: Public Records
Map
Nearby Homes
- 1454 N Mccall Ave
- 827 N Mccall Ave
- 9283 E Clinton Ave
- 2524 N Mccall Ave
- 145 S de Wolf Ave
- 2511 N Del Rey Ave
- 8289 E Mckinley Ave
- 2165 Leonard Ave
- 505 E Indianola Ave
- 2630 N Del Rey Ave
- 505 N Indianola Ave
- 7296 E Belmont Ave
- 8285 E Shields Ave
- 424 N de Wolf Ave
- 2421 N Bethel Ave
- 541 N de Wolf Ave
- 4545 Griffith Ave
- 4731 Joaquin Ave
- 4553 Griffith Ave
- 3422 San Marino Ave
- 9760 E Olive Ave
- 9935 E Olive Ave
- 1671 N Mccall Ave
- 9728 E Olive Ave
- 9831 E Olive Ave
- 1627 N Mccall Ave
- 1653 N Mccall Ave
- 9705 E Olive Ave
- 1416 N Mccall Ave
- 9659 E Olive Ave
- 1349 N Mccall Ave
- 1738 N Mccall Ave
- 9569 E Olive Ave
- 1358 N Mccall Ave
- 1388 N Mccall Ave
- 1312 N Mccall Ave
- 1266 N Mccall Ave
- 1254 N Mccall Ave
- 1221 N Mccall Ave
- 1838 N Mccall Ave