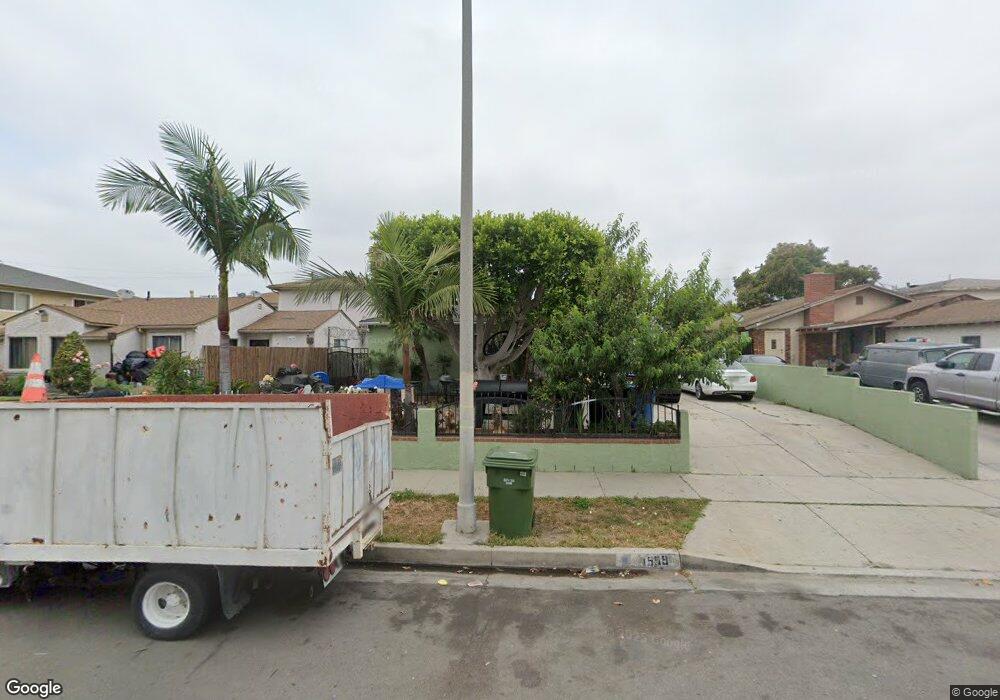
1559 W 206th St Torrance, CA 90501
Harbor Gateway NeighborhoodEstimated Value: $663,000 - $2,432,000
2
Beds
1
Bath
1,052
Sq Ft
$1,128/Sq Ft
Est. Value
About This Home
This home is located at 1559 W 206th St, Torrance, CA 90501 and is currently estimated at $1,186,319, approximately $1,127 per square foot. 1559 W 206th St is a home located in Los Angeles County with nearby schools including One Hundred Eighty-Sixth Street Elementary School, Stephen M. White Middle School, and Nathaniel Narbonne Senior High School.
Ownership History
Date
Name
Owned For
Owner Type
Purchase Details
Closed on
Sep 2, 2015
Sold by
Hernandez Mariela
Bought by
Alfaro Eva
Current Estimated Value
Purchase Details
Closed on
Feb 18, 2007
Sold by
Alfaro Eva and Hernandez Mariela
Bought by
Alfaro Eva
Purchase Details
Closed on
Jun 26, 2002
Sold by
Alfaro Eva and Alfaro Lourdez
Bought by
Alfaro Eva
Purchase Details
Closed on
Aug 8, 1995
Sold by
Federal Home Loan Mortgage Corporation
Bought by
Alfaro Eva and Alfaro Lourdes
Home Financials for this Owner
Home Financials are based on the most recent Mortgage that was taken out on this home.
Original Mortgage
$88,350
Interest Rate
7.8%
Purchase Details
Closed on
Nov 23, 1994
Sold by
Perez Lidia and Federal Home Loan Mortgage Cor
Bought by
Federal Home Loan Mortgage Corporation
Create a Home Valuation Report for This Property
The Home Valuation Report is an in-depth analysis detailing your home's value as well as a comparison with similar homes in the area
Home Values in the Area
Average Home Value in this Area
Purchase History
| Date | Buyer | Sale Price | Title Company |
|---|---|---|---|
| Alfaro Eva | -- | Accommodation | |
| Alfaro Eva | -- | None Available | |
| Alfaro Eva | -- | -- | |
| Alfaro Eva | $93,000 | First American Title Co | |
| Federal Home Loan Mortgage Corporation | $163,900 | First Southwestern Title |
Source: Public Records
Mortgage History
| Date | Status | Borrower | Loan Amount |
|---|---|---|---|
| Previous Owner | Alfaro Eva | $88,350 |
Source: Public Records
Tax History Compared to Growth
Tax History
| Year | Tax Paid | Tax Assessment Tax Assessment Total Assessment is a certain percentage of the fair market value that is determined by local assessors to be the total taxable value of land and additions on the property. | Land | Improvement |
|---|---|---|---|---|
| 2025 | $3,681 | $278,433 | $233,319 | $45,114 |
| 2024 | $3,681 | $272,975 | $228,745 | $44,230 |
| 2023 | $3,612 | $267,623 | $224,260 | $43,363 |
| 2022 | $3,453 | $262,376 | $219,863 | $42,513 |
| 2021 | $3,406 | $257,232 | $215,552 | $41,680 |
| 2019 | $3,307 | $249,604 | $209,159 | $40,445 |
| 2018 | $3,208 | $244,710 | $205,058 | $39,652 |
| 2017 | $3,136 | $239,913 | $201,038 | $38,875 |
| 2016 | $3,058 | $235,210 | $197,097 | $38,113 |
| 2015 | $3,011 | $231,678 | $194,137 | $37,541 |
| 2014 | $3,022 | $227,141 | $190,335 | $36,806 |
Source: Public Records
Map
Nearby Homes
- 1502 W 205th St
- 20315 Denker Ave Unit 28
- 20315 Denker Ave Unit 11
- 1636 W 205th St
- 1514 W 207th St Unit C
- 1551 Del Amo Blvd
- 1566 W 208th St
- 1629 W 208th St
- 1633 Del Amo Blvd
- 1667 W 208th St
- 1601 Torrance Blvd
- 20813 Normandie Ave
- 20907 Halldale Ave
- 20414 Kenwood Ave
- 21114 La Salle Ave
- 1291 Bonnet Way
- 20612 Kenwood Ave
- 1145 Milton St
- 20518 Raymond Ave
- 20710 Raymond Ave
- 1551 W 206th St
- 1549 W 206th St
- 20516 Harvard Blvd
- 1558 W 205th St
- 1564 W 205th St Unit 3
- 1564 W 205th St
- 1554 W 205th St
- 1545 W 206th St
- 1570 W 205th St
- 1548 W 205th St
- 1539 W 206th St
- 1539 W 206th St Unit B
- 1539 W 206th St Unit D
- 1539 W 206th St Unit B
- 1539 W 206th St
- 1539 W 206th St Unit C
- 20502 Harvard Blvd
- 1558 W 206th St
- 1544 W 205th St
- 1554 W 206th St