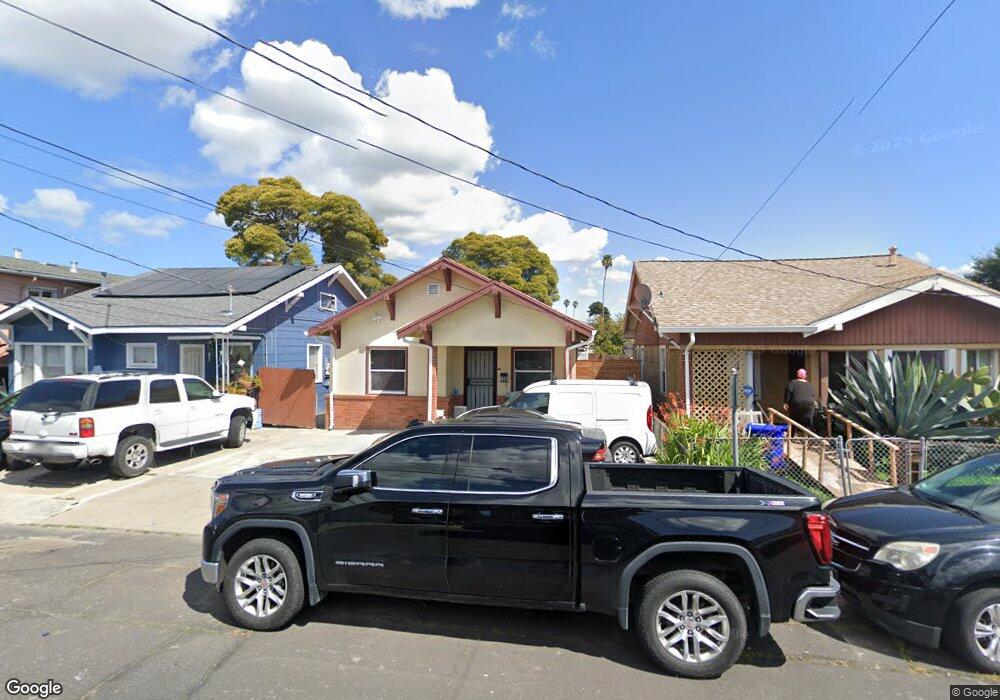
156 17th St Richmond, CA 94801
City Central NeighborhoodEstimated Value: $360,000 - $542,000
2
Beds
1
Bath
875
Sq Ft
$528/Sq Ft
Est. Value
About This Home
This home is located at 156 17th St, Richmond, CA 94801 and is currently estimated at $462,193, approximately $528 per square foot. 156 17th St is a home located in Contra Costa County with nearby schools including Nystrom Elementary School, Lovonya DeJean Middle School, and John F. Kennedy High School.
Ownership History
Date
Name
Owned For
Owner Type
Purchase Details
Closed on
Jul 22, 2022
Sold by
Family Trust
Bought by
Calmo Jose Ramos and Ramos Cecilia Marie
Current Estimated Value
Home Financials for this Owner
Home Financials are based on the most recent Mortgage that was taken out on this home.
Original Mortgage
$411,302
Outstanding Balance
$393,636
Interest Rate
5.81%
Mortgage Type
FHA
Estimated Equity
$68,557
Purchase Details
Closed on
Dec 6, 2017
Sold by
Wade John W
Bought by
Wade John William and Wade Lynn Jung
Home Financials for this Owner
Home Financials are based on the most recent Mortgage that was taken out on this home.
Original Mortgage
$275,400
Interest Rate
3.94%
Mortgage Type
Commercial
Purchase Details
Closed on
Mar 1, 2000
Sold by
Wade John W Tre
Bought by
Family Trust Of John W & Lynn Jung Wade
Purchase Details
Closed on
May 9, 1997
Sold by
Wade John W
Bought by
The Trust Of John W Wade
Create a Home Valuation Report for This Property
The Home Valuation Report is an in-depth analysis detailing your home's value as well as a comparison with similar homes in the area
Home Values in the Area
Average Home Value in this Area
Purchase History
We collect this data history from publicly available records. To have your information removed, we recommend requesting removal directly through your county’s website.
| Date | Buyer | Sale Price | Title Company |
|---|---|---|---|
| Calmo Jose Ramos | $425,000 | Old Republic Title | |
| Wade John William | -- | North American Title | |
| Family Trust Of John W & Lynn Jung Wade | -- | -- | |
| The Trust Of John W Wade | -- | -- |
Source: Public Records
Mortgage History
We collect this data history from publicly available records. To have your information removed, we recommend requesting removal directly through your county’s website.
| Date | Status | Borrower | Loan Amount |
|---|---|---|---|
| Open | Calmo Jose Ramos | $411,302 | |
| Previous Owner | Wade John William | $275,400 |
Source: Public Records
Tax History
| Year | Tax Paid | Tax Assessment Tax Assessment Total Assessment is a certain percentage of the fair market value that is determined by local assessors to be the total taxable value of land and additions on the property. | Land | Improvement |
|---|---|---|---|---|
| 2025 | $7,776 | $442,170 | $338,130 | $104,040 |
| 2024 | $7,514 | $433,500 | $331,500 | $102,000 |
| 2023 | $7,514 | $425,000 | $325,000 | $100,000 |
| 2022 | $2,288 | $61,588 | $20,214 | $41,374 |
| 2021 | $2,218 | $60,381 | $19,818 | $40,563 |
| 2019 | $2,068 | $58,592 | $19,231 | $39,361 |
| 2018 | $1,985 | $57,444 | $18,854 | $38,590 |
| 2017 | $1,918 | $56,319 | $18,485 | $37,834 |
| 2016 | $1,854 | $55,216 | $18,123 | $37,093 |
| 2015 | $1,810 | $54,387 | $17,851 | $36,536 |
| 2014 | $1,803 | $53,323 | $17,502 | $35,821 |
Source: Public Records
Map
Nearby Homes
- 1532 Chanslor Ave
- 1532 Chanslor Ave Unit T
- 1532 Chanslor Ave
- 2031 Chanslor Ave
- 228 15th St
- 138 S 17th St
- 1401 Bissell Ave
- 2107 Ohio Ave
- 10 12th St
- 338 Village Ln
- 1502 Nevin Plaza
- 467 Metro Walk Way
- 245 24th St
- 421 Metro Walk Way
- 0 Broadway
- 2520 Chanslor Ave
- 72 Murdock St
- 1827 Barrett Ave
- 1910 Virginia Ave
- 2415 Maine Ave
Your Personal Tour Guide
Ask me questions while you tour the home.