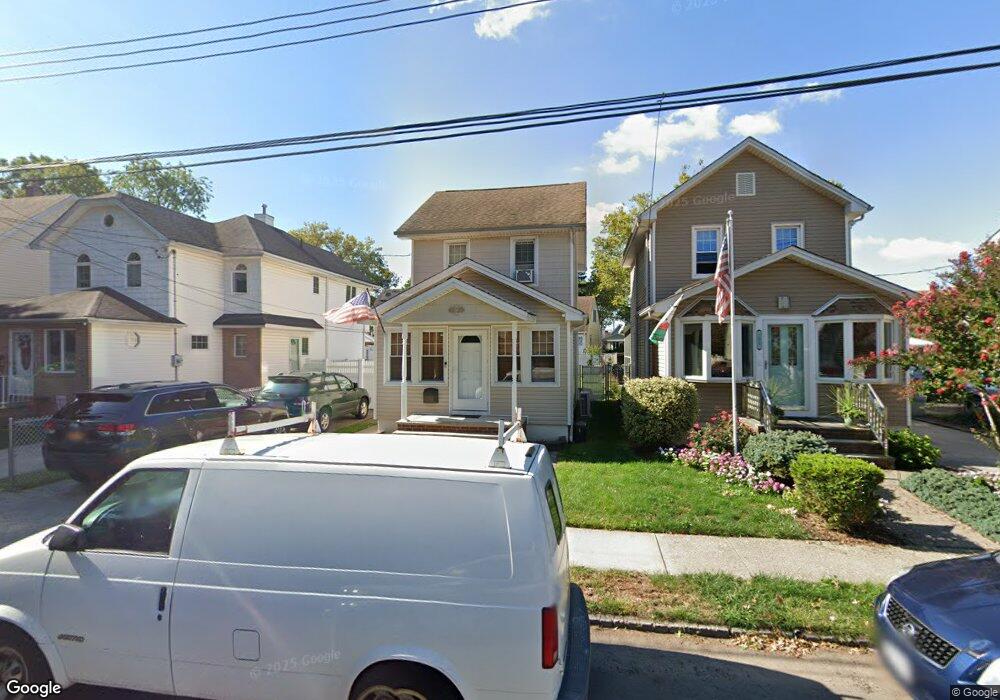
156 Burbank Ave Staten Island, NY 10306
New Dorp NeighborhoodEstimated Value: $595,315 - $726,000
2
Beds
1
Bath
956
Sq Ft
$705/Sq Ft
Est. Value
About This Home
This home is located at 156 Burbank Ave, Staten Island, NY 10306 and is currently estimated at $674,329, approximately $705 per square foot. 156 Burbank Ave is a home located in Richmond County with nearby schools including P.S. 41 The Stephanie a Vierno School, Is 2 George L Egbert, and New Dorp High School.
Ownership History
Date
Name
Owned For
Owner Type
Purchase Details
Closed on
May 12, 2006
Sold by
Lobaito Mary and Lobaito Paul
Bought by
Keane Denis G
Current Estimated Value
Home Financials for this Owner
Home Financials are based on the most recent Mortgage that was taken out on this home.
Original Mortgage
$260,000
Outstanding Balance
$152,468
Interest Rate
6.62%
Mortgage Type
Purchase Money Mortgage
Estimated Equity
$521,861
Purchase Details
Closed on
Jan 26, 2006
Sold by
Lobaito Mary
Bought by
Lobaito Paul
Create a Home Valuation Report for This Property
The Home Valuation Report is an in-depth analysis detailing your home's value as well as a comparison with similar homes in the area
Home Values in the Area
Average Home Value in this Area
Purchase History
| Date | Buyer | Sale Price | Title Company |
|---|---|---|---|
| Keane Denis G | $369,900 | None Available | |
| Lobaito Paul | -- | None Available |
Source: Public Records
Mortgage History
| Date | Status | Borrower | Loan Amount |
|---|---|---|---|
| Open | Keane Denis G | $260,000 |
Source: Public Records
Tax History Compared to Growth
Tax History
| Year | Tax Paid | Tax Assessment Tax Assessment Total Assessment is a certain percentage of the fair market value that is determined by local assessors to be the total taxable value of land and additions on the property. | Land | Improvement |
|---|---|---|---|---|
| 2025 | $5,841 | $32,820 | $11,046 | $21,774 |
| 2024 | $5,853 | $35,040 | $10,282 | $24,758 |
| 2023 | $5,556 | $28,757 | $8,210 | $20,547 |
| 2022 | $5,129 | $35,820 | $11,820 | $24,000 |
| 2021 | $5,399 | $35,400 | $11,820 | $23,580 |
| 2020 | $5,114 | $32,760 | $11,820 | $20,940 |
| 2019 | $5,021 | $28,980 | $11,820 | $17,160 |
| 2018 | $4,587 | $23,964 | $8,924 | $15,040 |
| 2017 | $4,309 | $22,608 | $11,538 | $11,070 |
| 2016 | $4,204 | $22,578 | $11,346 | $11,232 |
| 2015 | $3,757 | $21,300 | $10,740 | $10,560 |
| 2014 | $3,757 | $21,168 | $10,158 | $11,010 |
Source: Public Records
Map
Nearby Homes