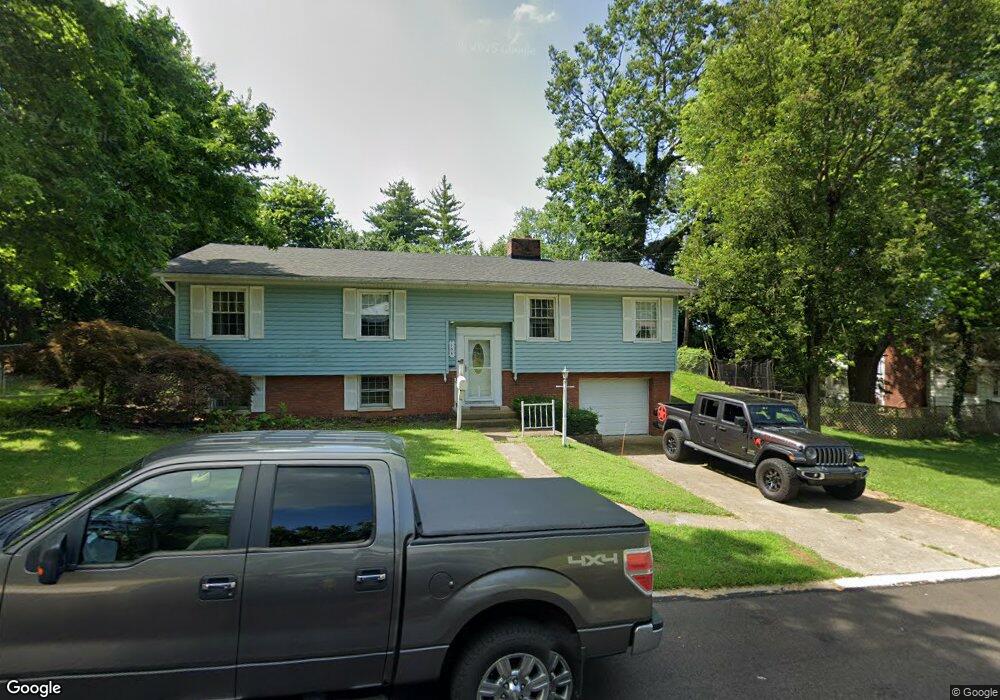
156 E Bryant Ave Franklin, OH 45005
Estimated Value: $248,972 - $270,000
3
Beds
2
Baths
1,363
Sq Ft
$193/Sq Ft
Est. Value
About This Home
This home is located at 156 E Bryant Ave, Franklin, OH 45005 and is currently estimated at $262,493, approximately $192 per square foot. 156 E Bryant Ave is a home located in Warren County with nearby schools including Franklin High School.
Ownership History
Date
Name
Owned For
Owner Type
Purchase Details
Closed on
Sep 14, 2016
Sold by
Birdwell J Greg and Birdwell Shelby J
Bought by
Rupe Keith and Rupe Emily
Current Estimated Value
Purchase Details
Closed on
Jun 13, 2003
Sold by
Birdwell Jerry G
Bought by
Birdwell J Greg and Birdwell Shelby J
Home Financials for this Owner
Home Financials are based on the most recent Mortgage that was taken out on this home.
Original Mortgage
$116,000
Interest Rate
5.51%
Mortgage Type
Purchase Money Mortgage
Purchase Details
Closed on
Apr 4, 1988
Sold by
Thacker Ivan S and Thacker Ivan S
Bought by
Whitt and Mervin O
Purchase Details
Closed on
Nov 16, 1987
Sold by
Thacker Ivan S and Thacker Lillia
Bought by
Thacker and Thacker Ivan S
Create a Home Valuation Report for This Property
The Home Valuation Report is an in-depth analysis detailing your home's value as well as a comparison with similar homes in the area
Home Values in the Area
Average Home Value in this Area
Purchase History
| Date | Buyer | Sale Price | Title Company |
|---|---|---|---|
| Rupe Keith | -- | None Available | |
| Birdwell J Greg | -- | -- | |
| Birdwell Jerry G | $116,000 | Midwest Abstract Company | |
| Whitt | $68,900 | -- | |
| Thacker | -- | -- |
Source: Public Records
Mortgage History
| Date | Status | Borrower | Loan Amount |
|---|---|---|---|
| Previous Owner | Birdwell Jerry G | $116,000 |
Source: Public Records
Tax History
| Year | Tax Paid | Tax Assessment Tax Assessment Total Assessment is a certain percentage of the fair market value that is determined by local assessors to be the total taxable value of land and additions on the property. | Land | Improvement |
|---|---|---|---|---|
| 2025 | $3,125 | $66,380 | $17,500 | $48,880 |
| 2024 | $3,125 | $66,380 | $17,500 | $48,880 |
| 2023 | $2,837 | $54,089 | $10,762 | $43,326 |
| 2022 | $2,783 | $54,089 | $10,763 | $43,327 |
| 2021 | $2,638 | $54,089 | $10,763 | $43,327 |
| 2020 | $2,432 | $43,974 | $8,750 | $35,224 |
| 2019 | $2,212 | $43,974 | $8,750 | $35,224 |
| 2018 | $2,181 | $43,974 | $8,750 | $35,224 |
| 2017 | $2,184 | $39,659 | $7,648 | $32,011 |
| 2016 | $2,226 | $39,659 | $7,648 | $32,011 |
| 2015 | $2,214 | $39,452 | $7,648 | $31,805 |
| 2014 | $2,271 | $39,450 | $7,650 | $31,800 |
| 2013 | $1,926 | $45,140 | $8,750 | $36,390 |
Source: Public Records
Map
Nearby Homes
- 0 Victoria Dr Unit 942075
- 0 Victoria Dr Unit 1852824
- 212 Rossman Ct
- 33 Stadia Dr
- 228 Bridge St
- 551 E 2nd St
- 657 E 2nd St
- 651 E 2nd St
- 210 N Riley Blvd
- 5 S River St
- 520 Arlington Ave
- 202 E 2nd St
- 413 Spring Ave
- 205 Oxford Rd
- 747 David Blvd
- 760 David Blvd
- 410 Park Ave
- 309 Oxford Rd
- 605 Spring Ave
- 0 E 4th St
- 146 E Bryant Ave
- 166 E Bryant Ave
- 151 E Bryant Ave
- 147 E Bryant Ave
- 167 E Bryant Ave
- 136 E Bryant Ave
- 176 E Bryant Ave
- 141 E Bryant Ave
- 130 Elaine Dr
- 177 E Bryant Ave
- 142 Elaine Dr
- 131 E Bryant Ave
- 120 Elaine Dr
- 126 E Bryant Ave
- 184 E Bryant Ave
- 150 Elaine Dr
- 187 E Bryant Ave
- 430 Victoria Dr
- 420 Victoria Dr
- 162 Elaine Dr
Your Personal Tour Guide
Ask me questions while you tour the home.