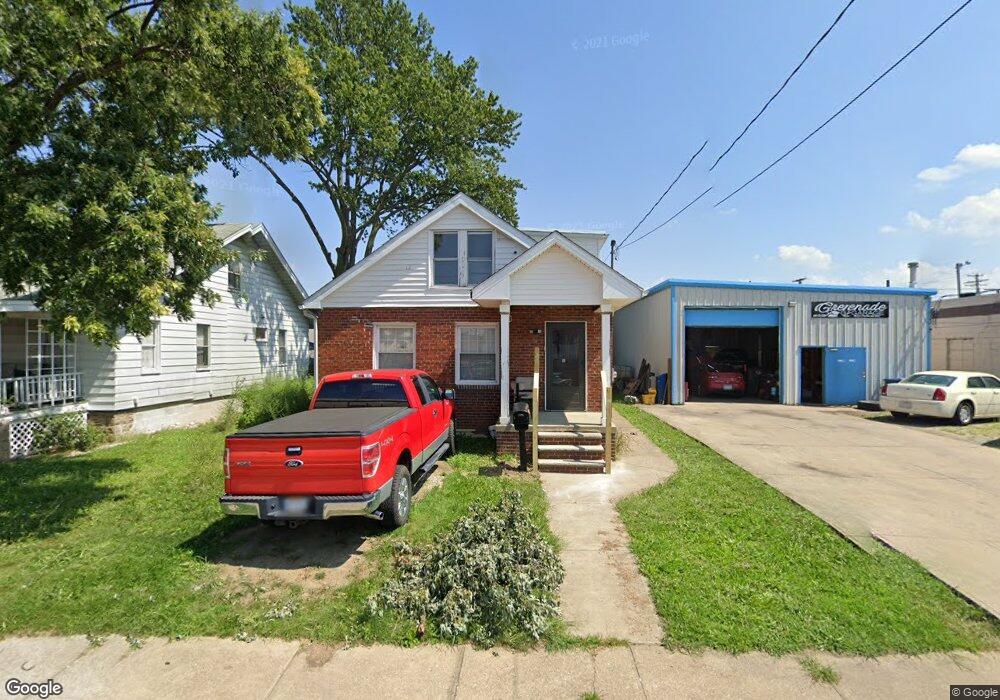
156 Eady Ct Elyria, OH 44035
Estimated Value: $113,000 - $139,000
1
Bed
1
Bath
960
Sq Ft
$134/Sq Ft
Est. Value
About This Home
This home is located at 156 Eady Ct, Elyria, OH 44035 and is currently estimated at $128,231, approximately $133 per square foot. 156 Eady Ct is a home located in Lorain County with nearby schools including Ely Elementary School, Northwood Middle School, and Elyria High School.
Ownership History
Date
Name
Owned For
Owner Type
Purchase Details
Closed on
May 18, 2021
Sold by
Paintiff Elizabeth G
Bought by
Paintiff Russell and Paintiff Elizabeth G
Current Estimated Value
Purchase Details
Closed on
Oct 26, 2018
Sold by
Paintiff Elizabeth G and Paintiff Russell L
Bought by
Paintiff Elizabeth G
Purchase Details
Closed on
Nov 28, 2006
Sold by
Citimortgage Inc
Bought by
Paintiff Russell L and Paintiff Elizabeth G
Purchase Details
Closed on
Aug 8, 2006
Sold by
Tollett Sheryl A
Bought by
Citifinancial Mortgage Co and Associates Financial Services Co Of Dela
Purchase Details
Closed on
Apr 30, 1998
Sold by
King Boyzy J
Bought by
Tollett Jerry W and Tollett Sheryl A
Home Financials for this Owner
Home Financials are based on the most recent Mortgage that was taken out on this home.
Original Mortgage
$43,125
Interest Rate
7.18%
Create a Home Valuation Report for This Property
The Home Valuation Report is an in-depth analysis detailing your home's value as well as a comparison with similar homes in the area
Home Values in the Area
Average Home Value in this Area
Purchase History
| Date | Buyer | Sale Price | Title Company |
|---|---|---|---|
| Paintiff Russell | -- | None Available | |
| Paintiff Elizabeth G | -- | None Available | |
| Paintiff Russell L | $32,000 | Accutitle Agency Inc | |
| Citifinancial Mortgage Co | $46,000 | None Available | |
| Tollett Jerry W | $57,500 | Midland Title |
Source: Public Records
Mortgage History
| Date | Status | Borrower | Loan Amount |
|---|---|---|---|
| Previous Owner | Tollett Jerry W | $43,125 | |
| Closed | Tollett Jerry W | $8,625 |
Source: Public Records
Tax History
| Year | Tax Paid | Tax Assessment Tax Assessment Total Assessment is a certain percentage of the fair market value that is determined by local assessors to be the total taxable value of land and additions on the property. | Land | Improvement |
|---|---|---|---|---|
| 2024 | $1,948 | $40,184 | $7,536 | $32,648 |
| 2023 | $1,529 | $27,388 | $4,435 | $22,953 |
| 2022 | $1,523 | $27,388 | $4,435 | $22,953 |
| 2021 | $1,527 | $27,388 | $4,435 | $22,953 |
| 2020 | $1,405 | $22,420 | $3,630 | $18,790 |
| 2019 | $1,397 | $22,420 | $3,630 | $18,790 |
| 2018 | $1,417 | $22,420 | $3,630 | $18,790 |
| 2017 | $1,469 | $23,120 | $3,630 | $19,490 |
| 2016 | $1,450 | $23,120 | $3,630 | $19,490 |
| 2015 | $1,358 | $23,120 | $3,630 | $19,490 |
| 2014 | $1,367 | $23,550 | $3,700 | $19,850 |
| 2013 | $1,354 | $23,550 | $3,700 | $19,850 |
Source: Public Records
Map
Nearby Homes
- 164 Woodbury St
- 127 Beebe Ave
- 120 Longford Ave
- 147 Bellfield Ave
- 171 S Logan St
- 144 Roosevelt Ave
- 805 Clark St
- 249 Roosevelt Ave
- 235 Brandtson Ave
- 147 Hamilton St
- 137 Lafayette St
- 409 Wesley Ave
- 340 Boston Ave
- 453 Kenyon Ave
- 463 Poplar St
- 209 Clark St
- 609 Princeton Ave
- 513 Gulf Rd
- 355 Kenyon Ave
- 347 Kenyon Ave
Your Personal Tour Guide
Ask me questions while you tour the home.