
Seller's Agent in 2025
Tina Landry
Keller Williams Realty North Central
(508) 797-2343
15 in this area
33 Total Sales


Estimated Value: $362,168 - $427,000
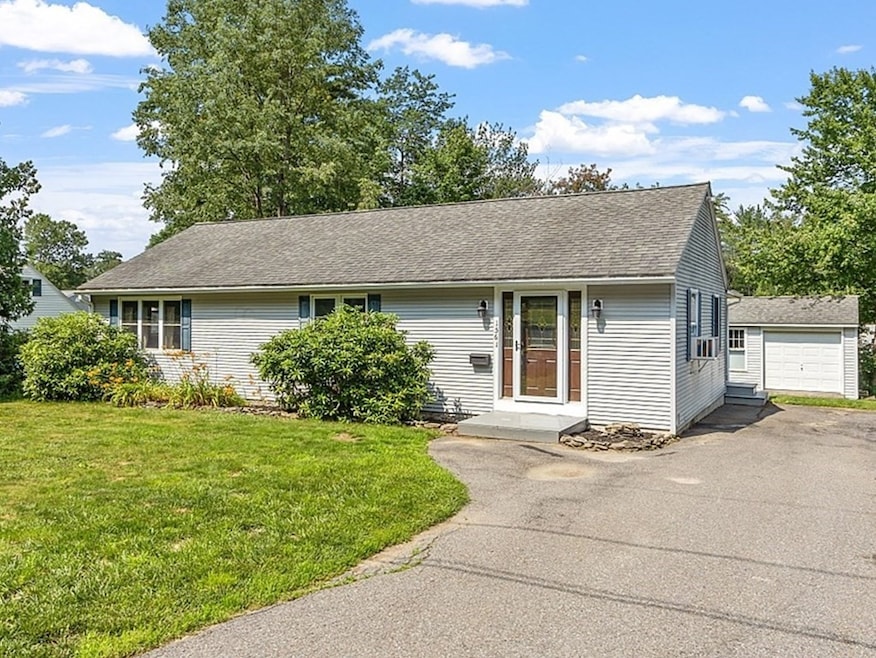
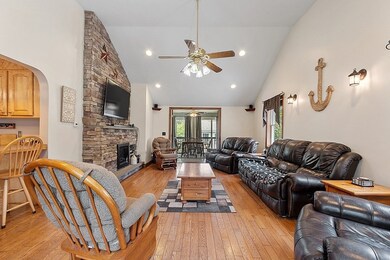
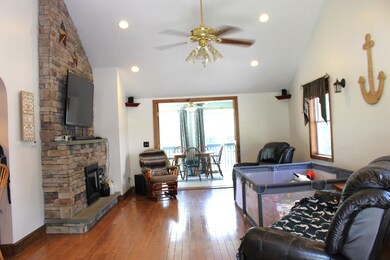
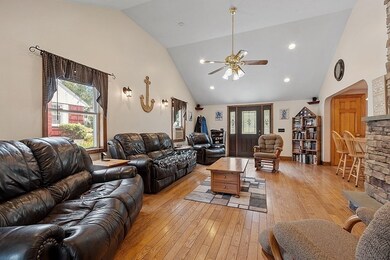
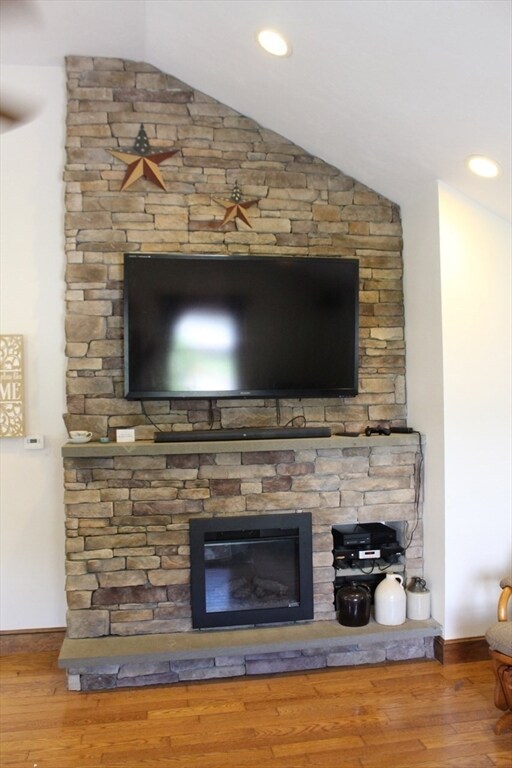
This beautifully maintained 3-bedroom ranch offers comfort, warmth, and modern updates. The inviting living room features gleaming hardwood floors and a striking stone fireplace with an electric insert—perfect for cozy evenings. Just off the living room, a bright sunroom opens to a spacious deck, ideal for relaxing or entertaining. The home was thoughtfully remodeled around 2002, including updates to the roof, windows, doors, and the addition of the sunroom. Enjoy the comfort of a radiant heated bathroom floor and peace of mind with key systems recently updated: Peerless furnace, PurePro Trio hot water tank, and oil tank (replaced 11/2021). Kitchen appliances include a newer dishwasher (approx. 1/2023), stove, washing machine (both 2021), Stainless Steel Refrigerator 2024 and Microwave 2024. Move in ready! Come see all this home has to offer!
Last Agent to Sell the Property
Keller Williams Realty North Central Listed on: 07/23/2025
We collect this data history from publicly available records. To have your information removed, we recommend requesting removal directly through your county’s website.
We collect this data history from publicly available records. To have your information removed, we recommend requesting removal directly through your county’s website.
| Date | Buyer | Sale Price | Title Company |
|---|---|---|---|
| $390,000 | -- | ||
| $390,000 | -- | ||
| $188,000 | -- | ||
| $188,000 | -- | ||
| $68,000 | -- | ||
| $68,000 | -- |
We collect this data history from publicly available records. To have your information removed, we recommend requesting removal directly through your county’s website.
| Date | Status | Borrower | Loan Amount |
|---|---|---|---|
| Open | $382,500 | ||
| Closed | $382,500 | ||
| Previous Owner | $150,400 | ||
| Previous Owner | $148,800 | ||
| Previous Owner | $30,000 |
We collect this data history from publicly available records. To have your information removed, we recommend requesting removal directly through your county’s website.
| Date | Event | Price | List to Sale | Price per Sq Ft |
|---|---|---|---|---|
| 08/29/2025 08/29/25 | Sold | $390,000 | +8.3% | $332 / Sq Ft |
| 07/28/2025 07/28/25 | Pending | -- | -- | -- |
| 07/23/2025 07/23/25 | For Sale | $360,000 | -- | $306 / Sq Ft |
We collect this data history from publicly available records. To have your information removed, we recommend requesting removal directly through your county’s website.
| Year | Tax Paid | Tax Assessment Tax Assessment Total Assessment is a certain percentage of the fair market value that is determined by local assessors to be the total taxable value of land and additions on the property. | Land | Improvement |
|---|---|---|---|---|
| 2025 | $4,498 | $313,200 | $67,100 | $246,100 |
| 2024 | $4,425 | $295,200 | $61,000 | $234,200 |
| 2023 | $4,078 | $252,800 | $60,100 | $192,700 |
| 2022 | $3,800 | $204,400 | $45,500 | $158,900 |
| 2021 | $3,705 | $184,900 | $39,600 | $145,300 |
| 2020 | $3,543 | $179,500 | $39,600 | $139,900 |
| 2019 | $3,341 | $165,900 | $39,600 | $126,300 |
| 2018 | $3,168 | $156,300 | $39,600 | $116,700 |
| 2017 | $3,035 | $148,200 | $39,600 | $108,600 |
| 2016 | $2,894 | $141,400 | $39,600 | $101,800 |
| 2015 | $2,797 | $140,000 | $39,600 | $100,400 |
| 2014 | $2,672 | $141,600 | $44,000 | $97,600 |
Seller's Agent in 2025
Tina Landry
Keller Williams Realty North Central
(508) 797-2343
15 in this area
33 Total Sales
Buyer's Agent in 2025
Tammy Morrison
Tammy Morrison Real Estate
(978) 407-9198
11 in this area
100 Total Sales
Source: MLS Property Information Network (MLS PIN)
MLS Number: 73408267
APN: GARD-000027M-000007-000033
Disclaimer: Certain information contained herein is derived from information provided by parties other than Homes.com. All information provided is deemed reliable, but is not guaranteed to be accurate and should be independently verified.
![]() The property listing data and information, or the Images, set forth herein were provided to MLS Property Information Network, Inc. from third party sources, including sellers, lessors and public records, and were compiled by MLS Property Information Network, Inc. The property listing data and information, and the Images, are for the personal, non-commercial use of consumers having a good faith interest in purchasing or leasing listed properties of the type displayed to them and may not be used for any purpose other than to identify prospective properties which such consumers may have a good faith interest in purchasing or leasing. MLS Property Information Network, Inc. and its subscribers disclaim any and all representations and warranties as to the accuracy of the property listing data and information, or as to the accuracy of any of the Images, set forth herein.
The property listing data and information, or the Images, set forth herein were provided to MLS Property Information Network, Inc. from third party sources, including sellers, lessors and public records, and were compiled by MLS Property Information Network, Inc. The property listing data and information, and the Images, are for the personal, non-commercial use of consumers having a good faith interest in purchasing or leasing listed properties of the type displayed to them and may not be used for any purpose other than to identify prospective properties which such consumers may have a good faith interest in purchasing or leasing. MLS Property Information Network, Inc. and its subscribers disclaim any and all representations and warranties as to the accuracy of the property listing data and information, or as to the accuracy of any of the Images, set forth herein.
Ask me questions while you tour the home.