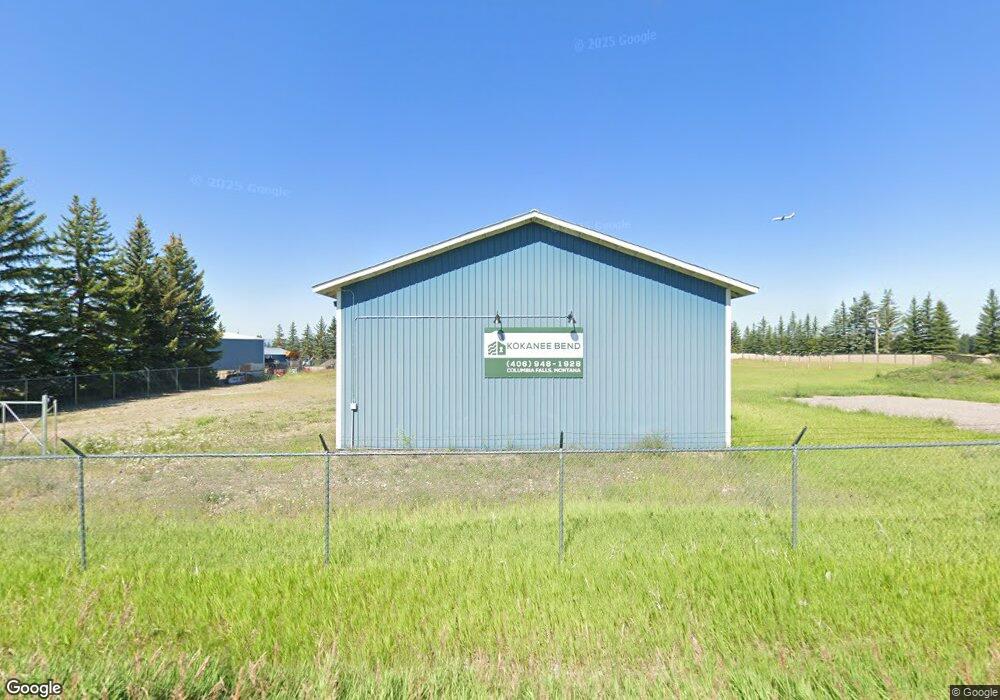
156 Hellman Ln Columbia Falls, MT 59912
Estimated Value: $491,545
--
Bed
--
Bath
4,000
Sq Ft
$123/Sq Ft
Est. Value
About This Home
This home is located at 156 Hellman Ln, Columbia Falls, MT 59912 and is currently estimated at $491,545, approximately $122 per square foot. 156 Hellman Ln is a home located in Flathead County with nearby schools including Ruder Elementary School, Columbia Falls Junior High School (7-8), and Columbia Falls High School.
Ownership History
Date
Name
Owned For
Owner Type
Purchase Details
Closed on
Oct 9, 2023
Sold by
Hill Jeff and Hill Leasa
Bought by
Anthony Cory and Anthony Jennifer
Current Estimated Value
Home Financials for this Owner
Home Financials are based on the most recent Mortgage that was taken out on this home.
Original Mortgage
$358,250
Outstanding Balance
$351,285
Interest Rate
7.18%
Mortgage Type
New Conventional
Estimated Equity
$140,260
Purchase Details
Closed on
Aug 27, 2020
Sold by
Sadino Tony and Sadino Sherri L
Bought by
Hill Jeff and Hill Leasa
Home Financials for this Owner
Home Financials are based on the most recent Mortgage that was taken out on this home.
Original Mortgage
$169,818
Interest Rate
2.9%
Mortgage Type
Future Advance Clause Open End Mortgage
Purchase Details
Closed on
Sep 8, 2005
Sold by
Clark Greg H and Clark Bette L
Bought by
Branch Lerry L and Branch Cindy L
Create a Home Valuation Report for This Property
The Home Valuation Report is an in-depth analysis detailing your home's value as well as a comparison with similar homes in the area
Home Values in the Area
Average Home Value in this Area
Purchase History
| Date | Buyer | Sale Price | Title Company |
|---|---|---|---|
| Anthony Cory | -- | Fidelity National Title | |
| Hill Jeff | -- | Fidelity National Title | |
| Branch Lerry L | -- | Sterling Title Services Inc |
Source: Public Records
Mortgage History
| Date | Status | Borrower | Loan Amount |
|---|---|---|---|
| Open | Anthony Cory | $358,250 | |
| Previous Owner | Hill Jeff | $169,818 |
Source: Public Records
Tax History Compared to Growth
Tax History
| Year | Tax Paid | Tax Assessment Tax Assessment Total Assessment is a certain percentage of the fair market value that is determined by local assessors to be the total taxable value of land and additions on the property. | Land | Improvement |
|---|---|---|---|---|
| 2025 | $3,196 | $463,900 | $0 | $0 |
| 2024 | $3,471 | $400,850 | $0 | $0 |
| 2023 | $3,486 | $400,850 | $0 | $0 |
| 2022 | $2,518 | $217,780 | $0 | $0 |
| 2021 | $2,634 | $217,780 | $0 | $0 |
| 2020 | $2,414 | $192,400 | $0 | $0 |
| 2019 | $2,284 | $192,400 | $0 | $0 |
| 2018 | $1,734 | $139,200 | $0 | $0 |
| 2017 | $1,687 | $139,200 | $0 | $0 |
| 2016 | $1,550 | $125,700 | $0 | $0 |
| 2015 | $1,540 | $125,700 | $0 | $0 |
| 2014 | $2,401 | $169,379 | $0 | $0 |
Source: Public Records
Map
Nearby Homes
- 185 Kokanee Bend Dr
- 425 Kokanee Bend Dr
- 1398 Waters Edge Way
- 1615 Ave
- 537 Rainbow Ridge Trail
- 1910 11th Ave W
- 57 Hidden Cedar Loop
- 558 Talbot Rd
- 1126 Columbia Falls Stage Rd
- 729 Scenic Dr
- 1318 Wildcat Dr
- 521 Evening Star Ln
- 1265 Jellison Rd
- 1605 & 1629 4th Ave W
- 165 Veteran Dr
- 9 & 11 Diane Rd
- 26 Martha Rd
- 3333 Middle Rd
- 7 Beth Rd
- 22 Grace Rd
- 150 Hellman Ln
- 121 Hellman Ln
- 59 Kokanee Bend Dr
- 122 Hellman Ln
- 175 Hellman Ln
- 145 Hellman Ln
- 105 Hellman Ln
- 523 Antler Bluff Ln
- 529 Antler Bluff Ln
- 147 River Butte Dr
- 577 Antler Bluff Ln
- 3540 Columbia Falls Stage
- 3389 Columbia Falls Stage
- 153 Hellman Ln
- 540 Antler Bluff Ln
- 246 Antler Bluff Ln
- 100 Stage Bend Ln
- NHN Antler Bluff Ln
- 151 River Butte Dr
- 590 Antler Bluff Ln