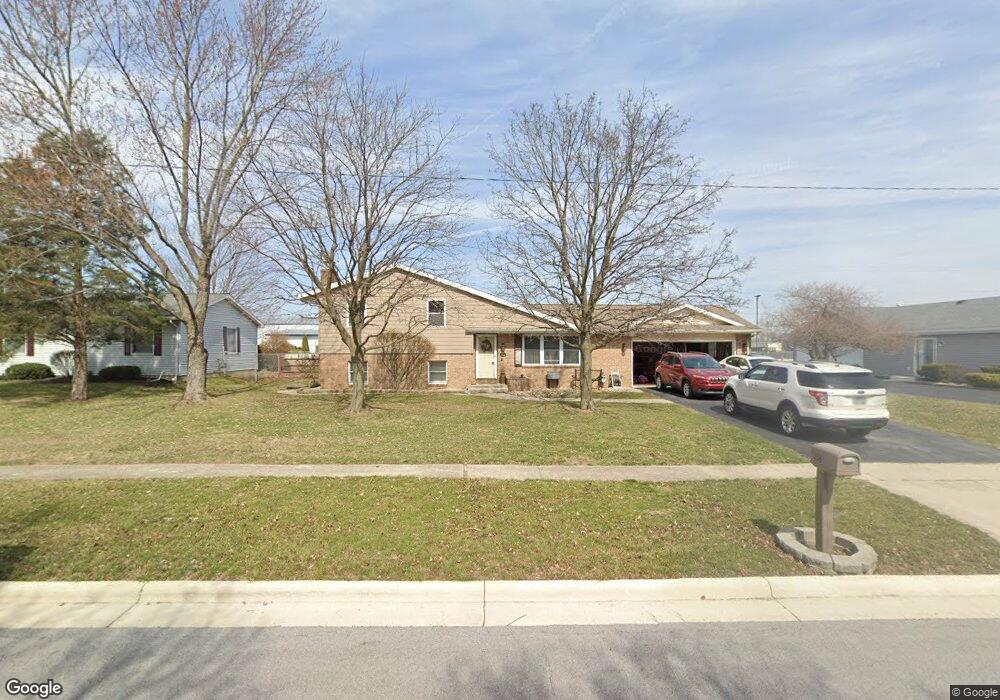
156 Hillshafer Dr Findlay, OH 45840
Estimated Value: $240,816 - $249,000
3
Beds
2
Baths
1,624
Sq Ft
$151/Sq Ft
Est. Value
About This Home
This home is located at 156 Hillshafer Dr, Findlay, OH 45840 and is currently estimated at $245,954, approximately $151 per square foot. 156 Hillshafer Dr is a home located in Hancock County with nearby schools including Bigelow Hill Elementary School, Northview Elementary School, and Glenwood Middle School.
Ownership History
Date
Name
Owned For
Owner Type
Purchase Details
Closed on
Sep 16, 2015
Bought by
Burkin Bryan
Current Estimated Value
Home Financials for this Owner
Home Financials are based on the most recent Mortgage that was taken out on this home.
Interest Rate
3.9%
Purchase Details
Closed on
Jun 9, 2010
Sold by
Dtr Industries Inc
Bought by
Brant Joseph M
Home Financials for this Owner
Home Financials are based on the most recent Mortgage that was taken out on this home.
Original Mortgage
$115,445
Interest Rate
5.13%
Mortgage Type
FHA
Purchase Details
Closed on
Dec 2, 1999
Sold by
Tokai Rubber Industries
Bought by
D T R Industries Inc
Purchase Details
Closed on
Sep 29, 1989
Bought by
Tokai Rubber Industry
Purchase Details
Closed on
Jan 10, 1986
Bought by
Talley Bobby J
Create a Home Valuation Report for This Property
The Home Valuation Report is an in-depth analysis detailing your home's value as well as a comparison with similar homes in the area
Home Values in the Area
Average Home Value in this Area
Purchase History
| Date | Buyer | Sale Price | Title Company |
|---|---|---|---|
| Burkin Bryan | $134,000 | -- | |
| Brant Joseph M | $117,000 | Mid American Title | |
| D T R Industries Inc | $136,681 | -- | |
| Tokai Rubber Industry | $84,000 | -- | |
| Talley Bobby J | $77,500 | -- |
Source: Public Records
Mortgage History
| Date | Status | Borrower | Loan Amount |
|---|---|---|---|
| Closed | Burkin Bryan | -- | |
| Previous Owner | Brant Joseph M | $115,445 |
Source: Public Records
Tax History Compared to Growth
Tax History
| Year | Tax Paid | Tax Assessment Tax Assessment Total Assessment is a certain percentage of the fair market value that is determined by local assessors to be the total taxable value of land and additions on the property. | Land | Improvement |
|---|---|---|---|---|
| 2024 | $2,086 | $58,700 | $11,490 | $47,210 |
| 2023 | $2,089 | $58,700 | $11,490 | $47,210 |
| 2022 | $2,081 | $58,700 | $11,490 | $47,210 |
| 2021 | $2,111 | $51,850 | $11,050 | $40,800 |
| 2020 | $2,111 | $51,850 | $11,050 | $40,800 |
| 2019 | $2,068 | $51,850 | $11,050 | $40,800 |
| 2018 | $1,962 | $45,140 | $9,600 | $35,540 |
| 2017 | $1,943 | $44,690 | $9,600 | $35,090 |
| 2016 | $1,918 | $44,690 | $9,600 | $35,090 |
| 2015 | $1,901 | $43,480 | $9,600 | $33,880 |
| 2014 | $1,901 | $43,480 | $9,600 | $33,880 |
| 2012 | $1,943 | $44,130 | $9,600 | $34,530 |
Source: Public Records
Map
Nearby Homes
- 3239 N Main St
- 126 Hillcrest Ave
- 3315 Terrace Ln
- 3300 Crosshill Dr
- 506 Hillcrest Ave
- 615 Hillcrest Ave
- 233 Bell Ave
- 0 County Road 220 Unit 6111396
- 0 County Road 220 Unit 6111394
- 0 County Road 220 Unit 6111400
- 128 Harrington Ave
- 0 Township Highway 99
- 12325 Township Highway 99
- 1310 Muirfield Dr
- 231 Tioga Ave
- 0 Allen Township 142
- 933 Laurel Ln
- 3018 Gleneagle Dr
- 2100 Candlewick Dr
- 1934 Geffs Ave
- 148 Hillshafer Dr
- 150 Hillshafer Dr Unit 148
- 150 Hillshafer Dr
- 200 Hillshafer Dr
- 142 Hillshafer Dr
- 208 Hillshafer Dr
- 155 Hillshafer Dr
- 149 Hillshafer Dr
- 201 Hillshafer Dr
- 216 Hillshafer Dr
- 143 Hillshafer Dr
- 209 Hillshafer Dr
- 135 Hillshafer Dr
- 217 Hillshafer Dr
- 126 Hillshafer Dr
- 152 Northcliff Dr
- 200 Northcliff Dr
- 224 Hillshafer Dr
- 208 Northcliff Dr
- 136 Northcliff Dr