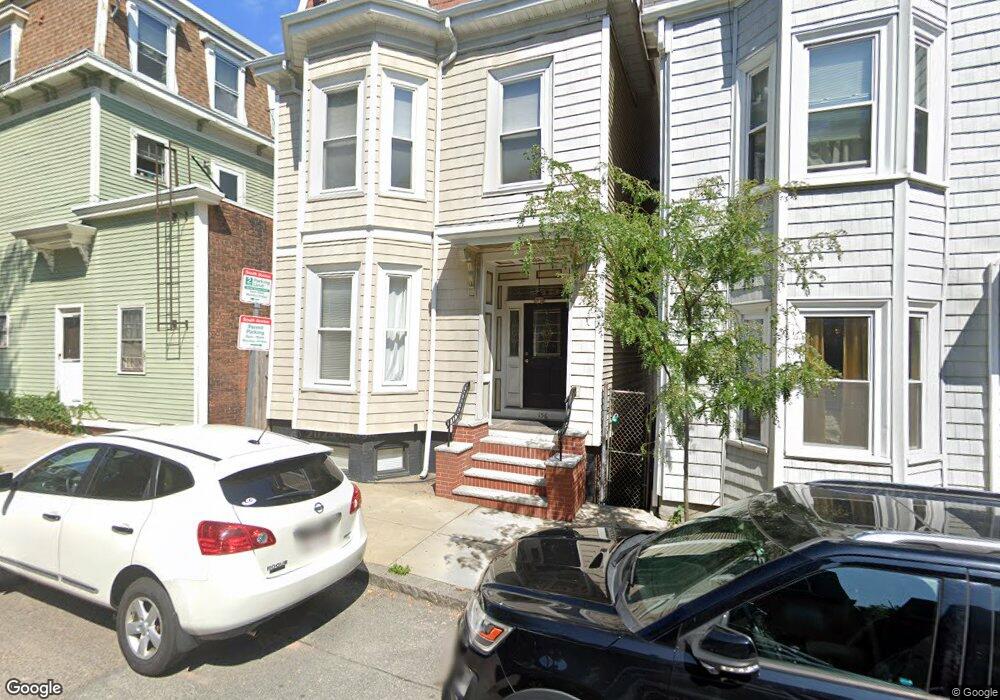
156 I St Unit 2 Boston, MA 02127
South Boston NeighborhoodEstimated Value: $707,000 - $874,000
2
Beds
1
Bath
879
Sq Ft
$878/Sq Ft
Est. Value
About This Home
This home is located at 156 I St Unit 2, Boston, MA 02127 and is currently estimated at $771,674, approximately $877 per square foot. 156 I St Unit 2 is a home located in Suffolk County with nearby schools including Up Academy Charter School Of Boston, Gate of Heaven Elementary School, and St Peter Academy.
Ownership History
Date
Name
Owned For
Owner Type
Purchase Details
Closed on
Nov 19, 2012
Sold by
Wilson Jeffrey and Wilson Erin
Bought by
Peluso Michael
Current Estimated Value
Home Financials for this Owner
Home Financials are based on the most recent Mortgage that was taken out on this home.
Original Mortgage
$359,100
Outstanding Balance
$248,145
Interest Rate
3.39%
Mortgage Type
New Conventional
Estimated Equity
$523,529
Purchase Details
Closed on
Nov 18, 2009
Sold by
Trapelo Park Assoc Llc
Bought by
Wilson Jeffrey and Stanley Erin
Home Financials for this Owner
Home Financials are based on the most recent Mortgage that was taken out on this home.
Original Mortgage
$303,300
Interest Rate
4.86%
Mortgage Type
Purchase Money Mortgage
Purchase Details
Closed on
May 1, 2009
Sold by
Us Bk
Bought by
Trapelo Park Assoc Llc
Purchase Details
Closed on
Nov 13, 2008
Sold by
Cosgrove Michael and Us Bk
Bought by
Us Bk
Create a Home Valuation Report for This Property
The Home Valuation Report is an in-depth analysis detailing your home's value as well as a comparison with similar homes in the area
Home Values in the Area
Average Home Value in this Area
Purchase History
| Date | Buyer | Sale Price | Title Company |
|---|---|---|---|
| Peluso Michael | $378,000 | -- | |
| Wilson Jeffrey | $337,000 | -- | |
| Trapelo Park Assoc Llc | $170,000 | -- | |
| Us Bk | $277,652 | -- |
Source: Public Records
Mortgage History
| Date | Status | Borrower | Loan Amount |
|---|---|---|---|
| Open | Peluso Michael | $359,100 | |
| Previous Owner | Wilson Jeffrey | $303,300 |
Source: Public Records
Tax History Compared to Growth
Tax History
| Year | Tax Paid | Tax Assessment Tax Assessment Total Assessment is a certain percentage of the fair market value that is determined by local assessors to be the total taxable value of land and additions on the property. | Land | Improvement |
|---|---|---|---|---|
| 2025 | $7,894 | $681,700 | $0 | $681,700 |
| 2024 | $7,227 | $663,000 | $0 | $663,000 |
| 2023 | $6,976 | $649,500 | $0 | $649,500 |
| 2022 | $6,793 | $624,400 | $0 | $624,400 |
| 2021 | $6,532 | $612,200 | $0 | $612,200 |
| 2020 | $6,071 | $574,900 | $0 | $574,900 |
| 2019 | $5,667 | $537,700 | $0 | $537,700 |
| 2018 | $5,365 | $511,900 | $0 | $511,900 |
| 2017 | $5,067 | $478,500 | $0 | $478,500 |
| 2016 | $4,965 | $451,400 | $0 | $451,400 |
| 2015 | $4,793 | $395,800 | $0 | $395,800 |
| 2014 | $4,445 | $353,300 | $0 | $353,300 |
Source: Public Records
Map
Nearby Homes
- 511 E 5th St Unit 3F
- 511 E 5th St Unit PH
- 511 E 5th St Unit 3R
- 511 E 5th St Unit 2R
- 527 E 7th St Unit 5
- 527 E 7th St Unit 4
- 527 E 7th St Unit 2
- 493 E 7th St
- 551 E 7th St
- 550 E 5th St
- 317 K St
- 479 E 6th St
- 170 H St
- 560 E 5th St Unit 2
- 178 H St
- 562 E 5th St
- 521 E 8th St Unit 6
- 511 E 8th St Unit A
- 616 E 4th St Unit 404
- 606 E 4th St Unit 301
- 156 I St Unit 3
- 156 I St Unit 1
- 156 I St Unit B
- 517 E 6th St Unit 2
- 517 E 6th St Unit 1
- 513 E 6th St Unit 1
- 513 E 6th St Unit 515
- 513 E 6th St Unit 515
- 513 E 6th St Unit 515
- 513 E 6th St Unit 515
- 515 E 6th St Unit 2
- 515 E 6th St Unit 3
- 513 E 6th St Unit 6 and 4
- 513 E 6th St Unit 4
- 515 E 6th St Unit 1
- 515 E 6th St Unit 1A
- 158 I St
- 158 I St Unit 3
- 158 I St Unit 2
- 158 I St Unit 1