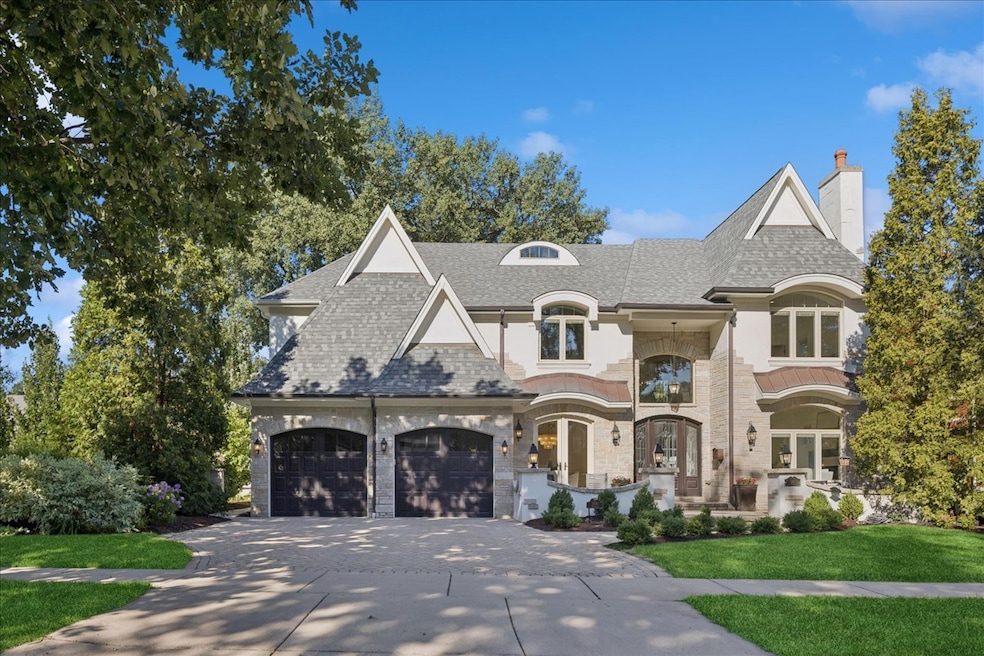
156 S Sunnyside Ave Elmhurst, IL 60126
Estimated payment $19,034/month
Highlights
- Tennis Courts
- 0.5 Acre Lot
- Landscaped Professionally
- Hawthorne Elementary School Rated A
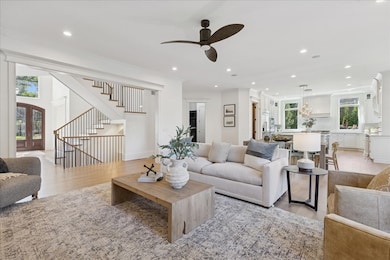
- Open Floorplan
- Deck
About This Home
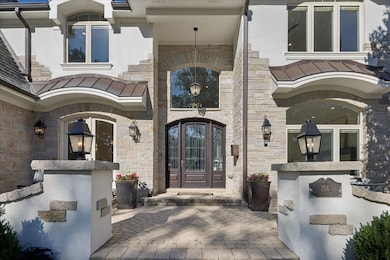
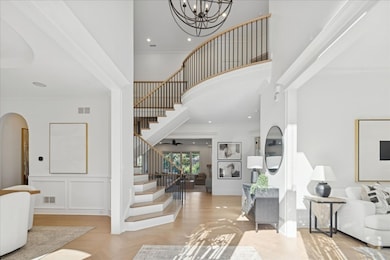
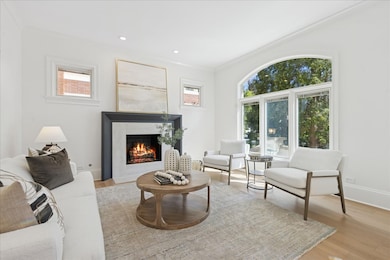
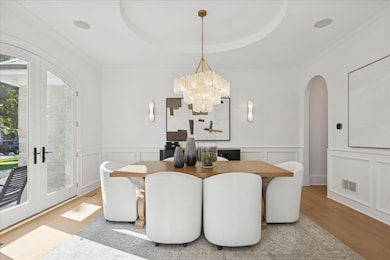
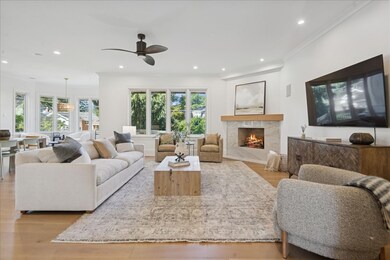
Sophisticated and fully reimagined, this one-of-a-kind 5BR/5.1BA estate in College View blends timeless architecture with today's most desired amenities. Set on an ultra-rare 160' wide double lot, the home has been comprehensively updated inside and out and now offers a lifestyle that rivals new construction. The wide-open layout showcases soaring ceilings, dramatic window walls, and wide-plank French oak flooring. A dream kitchen anchors the main level with a 48" Thermador range, dual dishwashers, Quartzite counters, oversized island, and both walk-in and butler's pantries. Retreat-worthy primary suite with sitting lounge, morning bar, spa-quality bath with radiant heated floors, soaking tub, and multi-spray shower. All bedrooms include custom-fitted en-suites. The lower level is designed for entertaining with a full bar, game/rec space, gym, steam shower, and dual saunas (infrared + hot). Outside, enjoy resort-style living with a Bluestone terrace, outdoor kitchen/bar with pizza oven, and a multi-sport court. Three-car heated garage, new roof (2023), HVAC (2024), generator, integrated Sonos, and radiant heating throughout. Prime location - walk to Hawthorne Elementary, York HS, Wilder Park, the Metra, and vibrant downtown Elmhurst
Listing Agent
@properties Christie's International Real Estate License #475127707 Listed on: 09/10/2025

Home Details
Home Type
- Single Family
Est. Annual Taxes
- $33,934
Year Built
- Built in 2007 | Remodeled in 2025
Lot Details
- 0.5 Acre Lot
- Lot Dimensions are 160 x 131
- Landscaped Professionally
- Paved or Partially Paved Lot
- Sprinkler System
Parking
- 3 Car Garage
Home Design
- Cottage
- Asphalt Roof
- Stone Siding
- Concrete Perimeter Foundation
Interior Spaces
- 5,234 Sq Ft Home
- 2-Story Property
- Open Floorplan
- Bar Fridge
- Bar
- Paneling
- Ceiling Fan
- Gas Log Fireplace
- Window Screens
- Entrance Foyer
- Family Room with Fireplace
- 3 Fireplaces
- Living Room with Fireplace
- Sitting Room
- Breakfast Room
- Formal Dining Room
- Home Office
- Recreation Room
- Game Room
- Home Gym
Kitchen
- Double Oven
- Gas Cooktop
- Range Hood
- Microwave
- High End Refrigerator
- Dishwasher
- Wine Refrigerator
- Stainless Steel Appliances
- Disposal
Flooring
- Wood
- Carpet
Bedrooms and Bathrooms
- 5 Bedrooms
- 5 Potential Bedrooms
- Walk-In Closet
- Bidet
- Dual Sinks
- Soaking Tub
- Steam Shower
- European Shower
- Shower Body Spray
- Separate Shower
Laundry
- Laundry Room
- Dryer
- Washer
- Sink Near Laundry
Basement
- Basement Fills Entire Space Under The House
- Sump Pump
- Fireplace in Basement
- Finished Basement Bathroom
Home Security
- Home Security System
- Carbon Monoxide Detectors
Outdoor Features
- Tennis Courts
- Deck
- Patio
- Outdoor Kitchen
- Fire Pit
- Shed
- Outdoor Grill
Schools
- Hawthorne Elementary School
- Sandburg Middle School
- York Community High School
Utilities
- Forced Air Zoned Cooling and Heating System
- Heating System Uses Natural Gas
- Radiant Heating System
- 200+ Amp Service
- Power Generator
- Lake Michigan Water
- Multiple Water Heaters
Community Details
- College View Subdivision
Listing and Financial Details
- Homeowner Tax Exemptions
Map
Home Values in the Area
Average Home Value in this Area
Tax History
| Year | Tax Paid | Tax Assessment Tax Assessment Total Assessment is a certain percentage of the fair market value that is determined by local assessors to be the total taxable value of land and additions on the property. | Land | Improvement |
|---|---|---|---|---|
| 2024 | $33,934 | $571,065 | $196,609 | $374,456 |
| 2023 | $31,574 | $528,080 | $181,810 | $346,270 |
| 2022 | $30,418 | $507,640 | $174,770 | $332,870 |
| 2021 | $29,682 | $495,010 | $170,420 | $324,590 |
| 2020 | $28,551 | $484,170 | $166,690 | $317,480 |
| 2019 | $27,985 | $460,320 | $158,480 | $301,840 |
| 2018 | $29,734 | $485,960 | $150,020 | $335,940 |
| 2017 | $29,124 | $463,090 | $142,960 | $320,130 |
| 2016 | -- | $0 | $0 | $0 |
Property History
| Date | Event | Price | List to Sale | Price per Sq Ft |
|---|---|---|---|---|
| 09/29/2025 09/29/25 | Pending | -- | -- | -- |
| 09/10/2025 09/10/25 | For Sale | $3,090,000 | -- | $590 / Sq Ft |
Purchase History
| Date | Type | Sale Price | Title Company |
|---|---|---|---|
| Quit Claim Deed | -- | None Listed On Document | |
| Warranty Deed | $1,375,000 | First American Title | |
| Warranty Deed | $465,000 | Chicago Title Insurance Comp |
Mortgage History
| Date | Status | Loan Amount | Loan Type |
|---|---|---|---|
| Previous Owner | $1,025,000 | Purchase Money Mortgage | |
| Previous Owner | $465,000 | Purchase Money Mortgage |
Source: Midwest Real Estate Data (MRED)
MLS Number: 12451355
APN: 06-02-301-020
Disclaimer: Certain information contained herein is derived from information provided by parties other than Homes.com. All information provided is deemed reliable, but is not guaranteed to be accurate and should be independently verified.
![]() Based on information submitted to the MLS GRID. All data is obtained from various sources and may not have been verified by broker or MLS GRID. Supplied Open House Information is subject to change without notice. All information should be independently reviewed and verified for accuracy. Properties may or may not be listed by the office/agent presenting the information. Some IDX listings have been excluded from this website.
Based on information submitted to the MLS GRID. All data is obtained from various sources and may not have been verified by broker or MLS GRID. Supplied Open House Information is subject to change without notice. All information should be independently reviewed and verified for accuracy. Properties may or may not be listed by the office/agent presenting the information. Some IDX listings have been excluded from this website.
The Digital Millennium Copyright Act of 1998, 17 U.S.C. § 512 (the “DMCA”) provides recourse for copyright owners who believe that material appearing on the Internet infringes their rights under U.S. copyright law. If you believe in good faith that any content or material made available in connection with our website or services infringes your copyright, you (or your agent) may send us a notice requesting that the content or material be removed, or access to it blocked.
Notices must be sent in writing by email to DMCAnotice@MLSGrid.com.
The DMCA requires that your notice of alleged copyright infringement include the following information:
(1) description of the copyrighted work that is the subject of claimed infringement;
(2) description of the alleged infringing content and information sufficient to permit us to locate the content;
(3) contact information for you, including your address, telephone number and email address;
(4) a statement by you that you have a good faith belief that the content in the manner complained of is not authorized by the copyright owner, or its agent, or by the operation of any law;
(5) a statement by you, signed under penalty of perjury, that the information in the notification is accurate and that you have the authority to enforce the copyrights that are claimed to be infringed; and
(6) a physical or electronic signature of the copyright owner or a person authorized to act on the copyright owner’s behalf. Failure to include all of the above information may result in the delay of the processing of your complaint.
- 170 S Fairview Ave
- 508 W Alma St
- 255 S West Ave Unit 214
- 255 S West Ave Unit 413
- 452 W Alma St
- 355 W 1st St
- 120 N Walnut St
- 104 Evergreen Ave
- 196 N Walnut St
- 421 S Sunnyside Ave
- 285 N Ridgeland Ave
- 284 N Highland Ave
- 407 W North Ave
- 469 S Sunnyside Ave
- 322 N Highland Ave
- 193 N Elm Ave
- 131 W Adelaide St Unit 309
- 17W517 Manor Ln
- 211 N Hwy N
- 210 N Addison Ave Unit 202