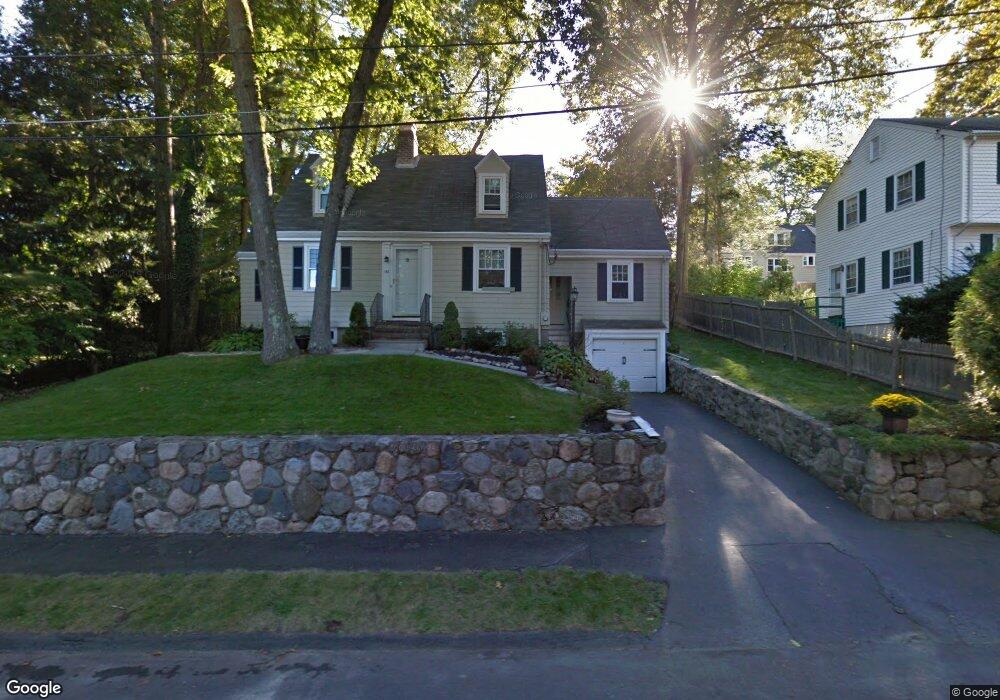
156 Thornton Rd Needham, MA 02492
Estimated Value: $1,410,000 - $1,903,000
3
Beds
2
Baths
1,852
Sq Ft
$848/Sq Ft
Est. Value
About This Home
This home is located at 156 Thornton Rd, Needham, MA 02492 and is currently estimated at $1,570,873, approximately $848 per square foot. 156 Thornton Rd is a home located in Norfolk County with nearby schools including Broadmeadow Elementary School, High Rock Middle School, and Pollard Middle School.
Ownership History
Date
Name
Owned For
Owner Type
Purchase Details
Closed on
Jun 22, 2009
Bought by
Svensson Patrik N and Svensson Jennifer A
Current Estimated Value
Purchase Details
Closed on
Nov 1, 2002
Purchase Details
Closed on
Jul 20, 2001
Sold by
Maurer Robert E and Maurer Beth E
Purchase Details
Closed on
Jun 26, 1998
Sold by
Stiles Marilyn A
Bought by
Maurer Robert E and Maurer Beth E
Create a Home Valuation Report for This Property
The Home Valuation Report is an in-depth analysis detailing your home's value as well as a comparison with similar homes in the area
Home Values in the Area
Average Home Value in this Area
Purchase History
| Date | Buyer | Sale Price | Title Company |
|---|---|---|---|
| Svensson Patrik N | $587,500 | -- | |
| -- | $541,200 | -- | |
| -- | $440,000 | -- | |
| Maurer Robert E | $335,000 | -- |
Source: Public Records
Mortgage History
| Date | Status | Borrower | Loan Amount |
|---|---|---|---|
| Open | Maurer Robert E | $411,000 | |
| Closed | Maurer Robert E | $417,000 | |
| Closed | Maurer Robert E | $41,000 |
Source: Public Records
Tax History
| Year | Tax Paid | Tax Assessment Tax Assessment Total Assessment is a certain percentage of the fair market value that is determined by local assessors to be the total taxable value of land and additions on the property. | Land | Improvement |
|---|---|---|---|---|
| 2025 | $13,608 | $1,283,800 | $774,000 | $509,800 |
| 2024 | $12,648 | $1,010,200 | $562,100 | $448,100 |
| 2023 | $12,717 | $975,200 | $562,100 | $413,100 |
| 2022 | $12,239 | $915,400 | $520,500 | $394,900 |
| 2021 | $11,928 | $915,400 | $520,500 | $394,900 |
| 2020 | $11,594 | $928,300 | $521,000 | $407,300 |
| 2019 | $10,901 | $879,800 | $473,600 | $406,200 |
| 2018 | $10,452 | $879,800 | $473,600 | $406,200 |
| 2017 | $9,831 | $826,800 | $473,600 | $353,200 |
| 2016 | $9,490 | $822,400 | $473,600 | $348,800 |
| 2015 | $9,285 | $822,400 | $473,600 | $348,800 |
| 2014 | $6,787 | $583,100 | $411,800 | $171,300 |
Source: Public Records
Map
Nearby Homes
- 176 Highgate St
- 31 Birds Hill Ave
- 68 Brookline St
- 190 Brookline St
- 126 Prince St
- 883 Greendale Ave
- 60 Douglas Rd
- 36 Otis St Unit 36
- 28 Green St
- 17 Lindbergh Ave
- 100 Bradford St
- 638 Webster St
- 638 Webster St Unit 638
- 971 Webster St
- 60 Sutton Rd
- 1011 Webster St
- 510 Webster St
- 68 Pleasant St Unit 68
- 50 Sterling Rd
- 233 Warren St
- 164 Thornton Rd
- 162 Thornton Rd
- 130 Birds Hill Ave
- 90 Morningside Rd
- 159 Thornton Rd
- 122 Birds Hill Ave
- 84 Morningside Rd
- 170 Thornton Rd
- 159 Thornton Rd
- 153 Thornton Rd
- 165 Thornton Rd
- 147 Thornton Rd
- 78 Morningside Rd
- 104 Aletha Rd
- 136 Thornton Rd
- 112 Birds Hill Ave
- 91 Morningside Rd
- 125 Birds Hill Ave
- 85 Morningside Rd
- 178 Thornton Rd
Your Personal Tour Guide
Ask me questions while you tour the home.