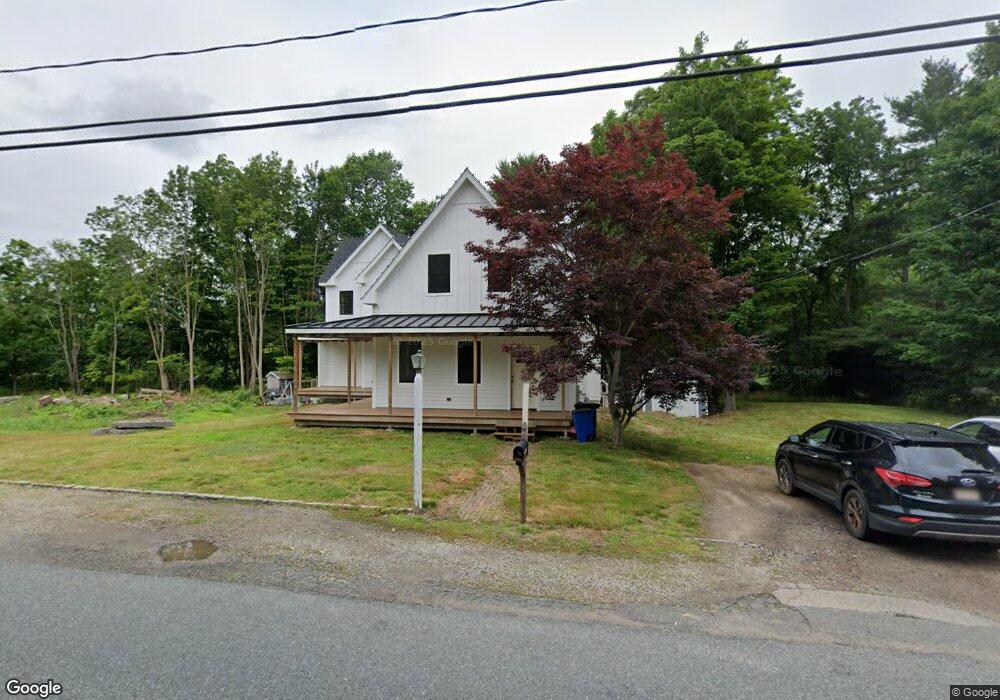
156 Union St East Bridgewater, MA 02333
Estimated Value: $476,000 - $894,193
4
Beds
2
Baths
1,780
Sq Ft
$432/Sq Ft
Est. Value
About This Home
This home is located at 156 Union St, East Bridgewater, MA 02333 and is currently estimated at $769,798, approximately $432 per square foot. 156 Union St is a home located in Plymouth County with nearby schools including Central Elementary School, Gordon W Mitchell Middle School, and East Bridgewater Jr./Sr. High School.
Ownership History
Date
Name
Owned For
Owner Type
Purchase Details
Closed on
Sep 1, 2010
Sold by
Egan James A and Egan Kathleen D
Bought by
Hutchings Sarah E and Hutchings Mark S
Current Estimated Value
Home Financials for this Owner
Home Financials are based on the most recent Mortgage that was taken out on this home.
Original Mortgage
$238,450
Outstanding Balance
$158,333
Interest Rate
4.55%
Mortgage Type
Purchase Money Mortgage
Estimated Equity
$611,465
Purchase Details
Closed on
Jun 13, 2008
Sold by
Eastman Jean Mallon and Eastman Carl W
Bought by
Egan James A and Egan Kathleen D
Home Financials for this Owner
Home Financials are based on the most recent Mortgage that was taken out on this home.
Original Mortgage
$213,660
Interest Rate
6.13%
Mortgage Type
Purchase Money Mortgage
Create a Home Valuation Report for This Property
The Home Valuation Report is an in-depth analysis detailing your home's value as well as a comparison with similar homes in the area
Home Values in the Area
Average Home Value in this Area
Purchase History
| Date | Buyer | Sale Price | Title Company |
|---|---|---|---|
| Hutchings Sarah E | $251,000 | -- | |
| Egan James A | $237,400 | -- |
Source: Public Records
Mortgage History
| Date | Status | Borrower | Loan Amount |
|---|---|---|---|
| Open | Hutchings Sarah E | $238,450 | |
| Previous Owner | Egan James A | $213,660 |
Source: Public Records
Tax History Compared to Growth
Tax History
| Year | Tax Paid | Tax Assessment Tax Assessment Total Assessment is a certain percentage of the fair market value that is determined by local assessors to be the total taxable value of land and additions on the property. | Land | Improvement |
|---|---|---|---|---|
| 2025 | $10,452 | $764,600 | $196,500 | $568,100 |
| 2024 | $10,261 | $741,400 | $189,000 | $552,400 |
| 2023 | $7,843 | $542,800 | $189,000 | $353,800 |
| 2022 | $4,552 | $291,800 | $171,900 | $119,900 |
| 2021 | $8,051 | $281,100 | $165,200 | $115,900 |
| 2020 | $4,949 | $277,900 | $159,100 | $118,800 |
| 2019 | $3,959 | $265,700 | $152,100 | $113,600 |
| 2018 | $4,650 | $258,900 | $152,100 | $106,800 |
| 2017 | $4,590 | $250,800 | $145,000 | $105,800 |
| 2016 | $4,529 | $249,400 | $145,000 | $104,400 |
| 2015 | $4,442 | $250,100 | $144,000 | $106,100 |
| 2014 | $4,337 | $249,700 | $141,000 | $108,700 |
Source: Public Records
Map
Nearby Homes
- 11 Harmony Crossing
- 41 Bedford St
- 71 Church St
- 11 Willow Ave
- 9 Hemlock Dr
- 282 Spring St
- 14 Mountain Ash Rd
- 261 Plymouth St
- 585 N Bedford St
- 611 N Bedford St
- 416 Highland St
- 407 W Union St
- 446 Elm St
- 505 N Central St
- 1 Simmons Place
- 78 Crystal Water Dr
- 217 Crystal Water Dr
- 182 Crystal Water Dr Unit 182
- 455 Plymouth St
- 590 Bedford St