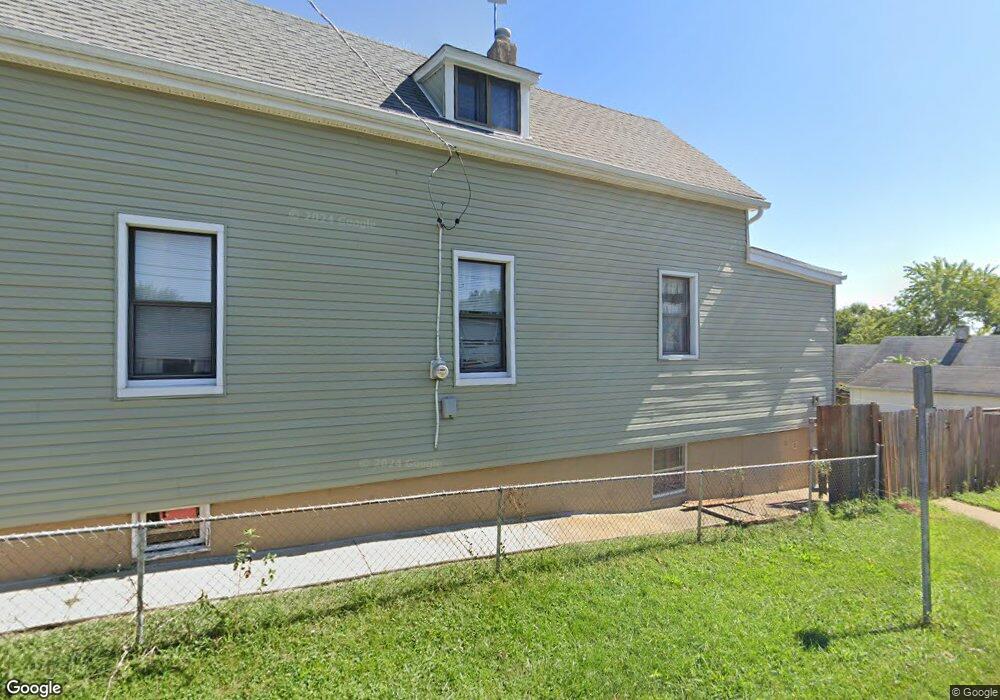
156 W Etta Ave Saint Louis, MO 63125
Lemay NeighborhoodEstimated Value: $113,000 - $162,000
2
Beds
1
Bath
950
Sq Ft
$135/Sq Ft
Est. Value
About This Home
This home is located at 156 W Etta Ave, Saint Louis, MO 63125 and is currently estimated at $127,777, approximately $134 per square foot. 156 W Etta Ave is a home located in St. Louis County with nearby schools including Hancock Place Elementary School, Hancock Place Middle School, and Hancock Place High School.
Ownership History
Date
Name
Owned For
Owner Type
Purchase Details
Closed on
Feb 5, 2024
Sold by
Kipper Robert M and Kipper Kelly M
Bought by
Kipper Robert M
Current Estimated Value
Purchase Details
Closed on
Jul 12, 2012
Sold by
Hsbc Bank Usa National Association
Bought by
Kipper Robert M and Kipper Kelly M
Purchase Details
Closed on
Jan 9, 2012
Sold by
Mattingly Patti L and Rollberg Robyn A
Bought by
Hsbc Bank Usa National Association
Purchase Details
Closed on
Aug 12, 2010
Sold by
Mattingly Patti
Bought by
Rollberg Robyn
Purchase Details
Closed on
Jan 16, 2007
Sold by
Poor Jerel L and Poor Linda K
Bought by
Rollberg Robyn A and Mattingly Patti
Home Financials for this Owner
Home Financials are based on the most recent Mortgage that was taken out on this home.
Original Mortgage
$102,000
Interest Rate
10.97%
Mortgage Type
Purchase Money Mortgage
Create a Home Valuation Report for This Property
The Home Valuation Report is an in-depth analysis detailing your home's value as well as a comparison with similar homes in the area
Home Values in the Area
Average Home Value in this Area
Purchase History
| Date | Buyer | Sale Price | Title Company |
|---|---|---|---|
| Kipper Robert M | -- | None Listed On Document | |
| Kipper Robert M | $27,000 | None Available | |
| Hsbc Bank Usa National Association | $122,791 | None Available | |
| Rollberg Robyn | -- | None Available | |
| Rollberg Robyn A | $102,000 | Copper Land & Title |
Source: Public Records
Mortgage History
| Date | Status | Borrower | Loan Amount |
|---|---|---|---|
| Previous Owner | Rollberg Robyn A | $102,000 |
Source: Public Records
Tax History
| Year | Tax Paid | Tax Assessment Tax Assessment Total Assessment is a certain percentage of the fair market value that is determined by local assessors to be the total taxable value of land and additions on the property. | Land | Improvement |
|---|---|---|---|---|
| 2025 | $1,309 | $23,140 | $7,260 | $15,880 |
| 2024 | $1,309 | $16,740 | $5,450 | $11,290 |
| 2023 | $1,243 | $16,740 | $5,450 | $11,290 |
| 2022 | $1,518 | $18,600 | $4,730 | $13,870 |
| 2021 | $1,491 | $18,600 | $4,730 | $13,870 |
| 2020 | $1,181 | $14,000 | $5,450 | $8,550 |
| 2019 | $1,178 | $14,000 | $5,450 | $8,550 |
| 2018 | $954 | $9,840 | $4,180 | $5,660 |
| 2017 | $938 | $9,840 | $4,180 | $5,660 |
| 2016 | $917 | $9,260 | $2,910 | $6,350 |
Source: Public Records
Map
Nearby Homes
- 9604 Gentry Ave
- 136 W Etta Ave
- 124 W Cartwright Ave
- 317 Forbes Ave
- 223 W Felton Ave
- 423 Degenhardt Ave
- 9704 S Broadway
- 9405 Gentry Ave
- 908 Wachtel Ave
- 717 Bartolet Ave
- 1710 Telegraph Rd
- 111 E Arlee Ave
- 939 Erskine Ave
- 1625 Telegraph Rd
- 826 Catskill Dr
- 712 Orient Ave
- 522 Lagro Ave
- 1656 Herault Place
- 1660 Blue Ridge Dr Unit G
- 210 Horn Ave
- 154 W Etta Ave
- 152 W Etta Ave
- 150 W Etta Ave
- 9521 Clyde Ave
- 9520 Clyde Ave
- 9519 Clyde Ave
- 148 W Etta Ave
- 9523 Clyde Ave
- 157 W Velma Ave
- 9514 Clyde Ave
- 9517 Clyde Ave
- 9525 Clyde Ave
- 153 W Velma Ave
- 146 W Etta Ave
- 9515 Clyde Ave
- 151 W Velma Ave
- 9529 Clyde Ave
- 147 W Velma Ave
- 9512 Clyde Ave
- 144 W Etta Ave