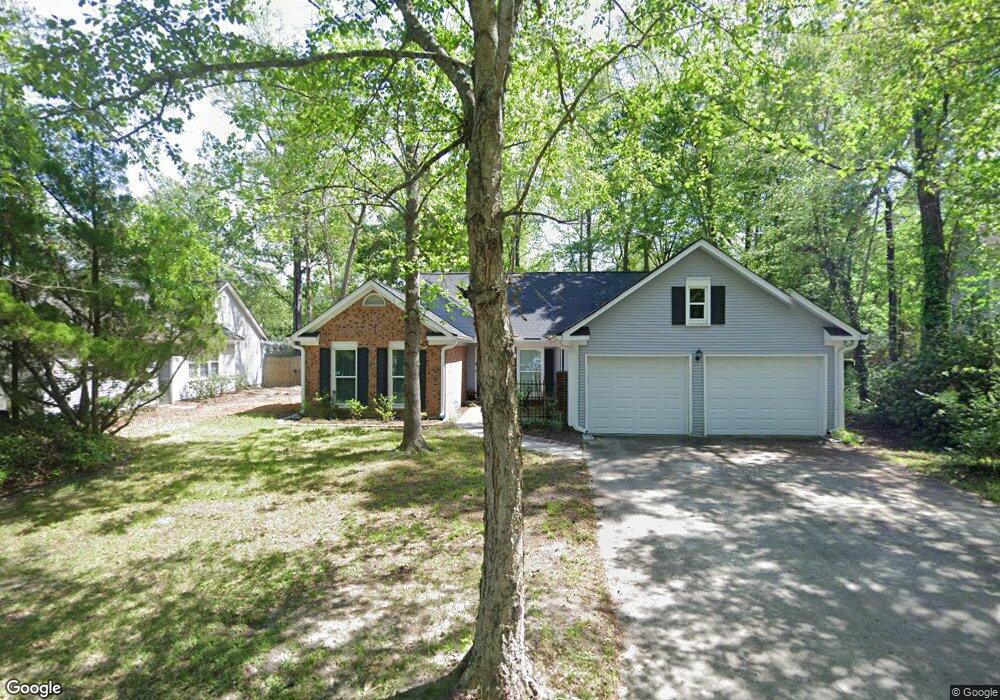
156 Wainwright Manor Summerville, SC 29485
Estimated Value: $349,011 - $373,000
4
Beds
2
Baths
1,791
Sq Ft
$199/Sq Ft
Est. Value
About This Home
This home is located at 156 Wainwright Manor, Summerville, SC 29485 and is currently estimated at $356,253, approximately $198 per square foot. 156 Wainwright Manor is a home located in Dorchester County with nearby schools including Flowertown Elementary School, Alston Middle School, and Ashley Ridge High School.
Ownership History
Date
Name
Owned For
Owner Type
Purchase Details
Closed on
May 14, 2020
Sold by
Sc Revitalize Llc
Bought by
Schow Esther
Current Estimated Value
Home Financials for this Owner
Home Financials are based on the most recent Mortgage that was taken out on this home.
Original Mortgage
$236,249
Outstanding Balance
$209,349
Interest Rate
3.3%
Mortgage Type
New Conventional
Estimated Equity
$146,904
Purchase Details
Closed on
Oct 23, 2019
Sold by
Remeika Leslie R and Remeika Jim
Bought by
Sc Revitalize Llc
Home Financials for this Owner
Home Financials are based on the most recent Mortgage that was taken out on this home.
Original Mortgage
$152,000
Interest Rate
3.6%
Mortgage Type
New Conventional
Purchase Details
Closed on
May 7, 2002
Sold by
Fetters Damon S and Fetters Angela S
Bought by
Remeika Leslie R
Purchase Details
Closed on
Jul 31, 2000
Sold by
Beth Ventiere
Bought by
Fetters Damon S and Fetters Angela S
Create a Home Valuation Report for This Property
The Home Valuation Report is an in-depth analysis detailing your home's value as well as a comparison with similar homes in the area
Home Values in the Area
Average Home Value in this Area
Purchase History
| Date | Buyer | Sale Price | Title Company |
|---|---|---|---|
| Schow Esther | $249,999 | None Available | |
| Sc Revitalize Llc | $160,000 | None Available | |
| Remeika Leslie R | $147,000 | -- | |
| Fetters Damon S | $130,000 | -- |
Source: Public Records
Mortgage History
| Date | Status | Borrower | Loan Amount |
|---|---|---|---|
| Open | Schow Esther | $236,249 | |
| Previous Owner | Sc Revitalize Llc | $152,000 |
Source: Public Records
Tax History Compared to Growth
Tax History
| Year | Tax Paid | Tax Assessment Tax Assessment Total Assessment is a certain percentage of the fair market value that is determined by local assessors to be the total taxable value of land and additions on the property. | Land | Improvement |
|---|---|---|---|---|
| 2024 | $2,794 | $11,746 | $4,000 | $7,746 |
| 2023 | $2,794 | $10,069 | $2,000 | $8,069 |
| 2022 | $2,278 | $9,850 | $2,000 | $7,850 |
| 2021 | $2,360 | $9,850 | $2,000 | $7,850 |
| 2020 | $1,791 | $6,730 | $1,200 | $5,530 |
| 2019 | $1,365 | $6,730 | $1,200 | $5,530 |
| 2018 | $1,154 | $6,730 | $1,200 | $5,530 |
| 2017 | $1,133 | $6,730 | $1,200 | $5,530 |
| 2016 | $1,112 | $6,730 | $1,200 | $5,530 |
| 2015 | $1,114 | $6,730 | $1,200 | $5,530 |
| 2014 | $1,091 | $167,785 | $0 | $0 |
| 2013 | -- | $6,710 | $0 | $0 |
Source: Public Records
Map
Nearby Homes
- 109 Thomaston Ave
- 301 Upshur Ct
- 107 Orchard Blossom Ln
- 164 Aleene Dr
- 198 Spencer Cir
- 194 Spencer Cir
- 220 Agrarian Ave
- 222 Agrarian Ave
- 224 Agrarian Ave
- 226 Agrarian Ave
- 214 Agrarian Ave
- 231 Agrarian Ave
- 218 Agrarian Ave
- 229 Agrarian Ave
- 227 Agrarian Ave
- 208 Agrarian Ave
- 133 Delaney Cir
- 103 Evance Ct
- 106 Mulberry Hill
- 109 Evance Ct
- 154 Wainwright Manor
- 158 Wainwright Manor
- 152 Wainwright Manor
- 160 Wainwright Manor
- 151 Wainwright Manor
- 157 Wainwright Manor
- 150 Wainwright Manor
- 162 Wainwright Manor
- 100 Smithfield Ave
- 161 Wainwright Manor
- 148 Wainwright Manor
- 145 Wainwright Manor
- 102 Smithfield Ave
- 143 Wainwright Manor
- 163 Wainwright Manor
- 146 Wainwright Manor
- 101 Smithfield Ave
- 144 Wainwright Manor
- 104 Smithfield Ave
- 141 Wainwright Manor