Estimated Value: $1,023,000 - $1,233,000
4
Beds
3
Baths
1,926
Sq Ft
$570/Sq Ft
Est. Value
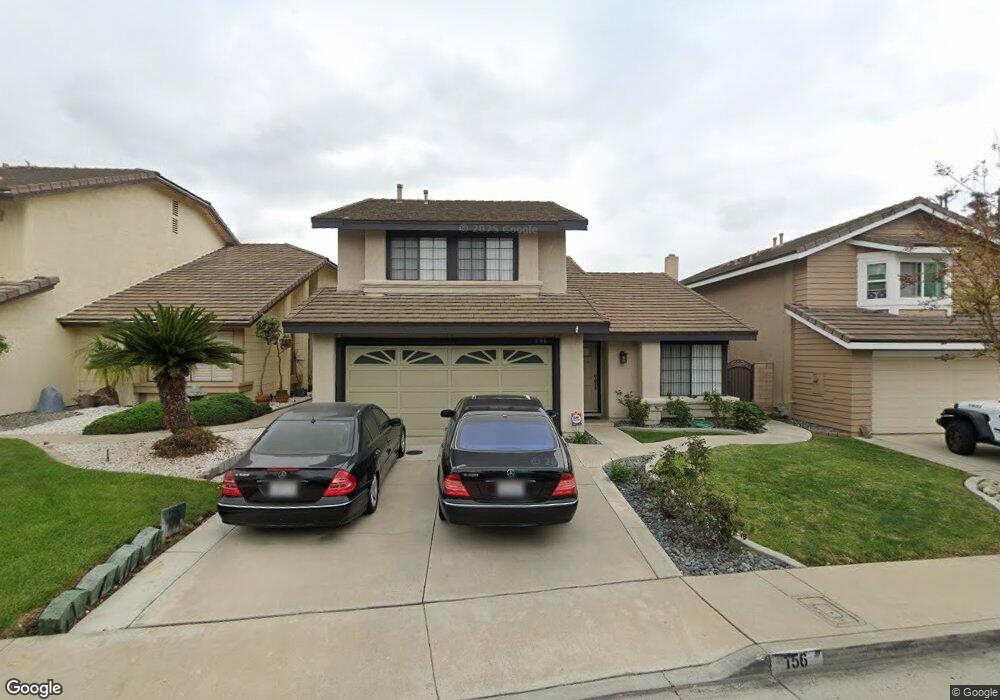
About This Home
This home is located at 156 Waterfall Ln, Brea, CA 92821 and is currently estimated at $1,096,897, approximately $569 per square foot. 156 Waterfall Ln is a home located in Orange County with nearby schools including Brea Country Hills Elementary School, Brea Junior High School, and Brea-Olinda High School.
Ownership History
Date
Name
Owned For
Owner Type
Purchase Details
Closed on
Nov 7, 2014
Sold by
Davis Richard F
Bought by
Davis Richard and The Richard Davis Revocable Trust
Current Estimated Value
Purchase Details
Closed on
Nov 18, 2002
Sold by
Davis Richard F
Bought by
Davis Rick
Home Financials for this Owner
Home Financials are based on the most recent Mortgage that was taken out on this home.
Original Mortgage
$300,700
Outstanding Balance
$121,122
Interest Rate
5.5%
Mortgage Type
New Conventional
Estimated Equity
$975,775
Purchase Details
Closed on
Nov 29, 2001
Sold by
Davis Deborah S
Bought by
Davis Richard F
Purchase Details
Closed on
Jul 31, 1996
Sold by
Krueger Leeward B and Krueger Victoria L
Bought by
Davis Rick and Davis Debbi
Home Financials for this Owner
Home Financials are based on the most recent Mortgage that was taken out on this home.
Original Mortgage
$176,900
Interest Rate
8.23%
Create a Home Valuation Report for This Property
The Home Valuation Report is an in-depth analysis detailing your home's value as well as a comparison with similar homes in the area
Home Values in the Area
Average Home Value in this Area
Purchase History
| Date | Buyer | Sale Price | Title Company |
|---|---|---|---|
| Davis Richard | -- | None Available | |
| Davis Richard | -- | None Available | |
| Davis Rick | -- | Landsafe Title | |
| Davis Richard F | -- | -- | |
| Davis Rick | $228,000 | Continental Lawyers Title Co |
Source: Public Records
Mortgage History
| Date | Status | Borrower | Loan Amount |
|---|---|---|---|
| Open | Davis Rick | $300,700 | |
| Closed | Davis Rick | $176,900 |
Source: Public Records
Tax History
| Year | Tax Paid | Tax Assessment Tax Assessment Total Assessment is a certain percentage of the fair market value that is determined by local assessors to be the total taxable value of land and additions on the property. | Land | Improvement |
|---|---|---|---|---|
| 2025 | $4,271 | $359,931 | $141,784 | $218,147 |
| 2024 | $4,271 | $352,874 | $139,004 | $213,870 |
| 2023 | $4,153 | $345,955 | $136,278 | $209,677 |
| 2022 | $4,112 | $339,172 | $133,606 | $205,566 |
| 2021 | $4,036 | $332,522 | $130,986 | $201,536 |
| 2020 | $4,009 | $329,113 | $129,643 | $199,470 |
| 2019 | $3,905 | $322,660 | $127,101 | $195,559 |
| 2018 | $3,848 | $316,334 | $124,609 | $191,725 |
| 2017 | $3,776 | $310,132 | $122,166 | $187,966 |
| 2016 | $3,703 | $304,051 | $119,770 | $184,281 |
| 2015 | $3,652 | $299,484 | $117,971 | $181,513 |
| 2014 | $3,548 | $293,618 | $115,660 | $177,958 |
Source: Public Records
Map
Nearby Homes
- 2050 Fallingleaf Cir
- 2304 Carrotwood Dr
- 2363 Morning Dew Dr
- 1796 Ravencrest Dr
- 2583 Sandpebble Ln
- 648 Pepperwood Dr
- 2761 E Stearns St
- 360 Meadow Ct
- 500 Silver Canyon Way
- 2851 Rolling Hills Dr Unit 178
- 2851 Rolling Hills Dr Unit 257
- 2851 Rolling Hills Dr Unit 248
- 2851 Rolling Hills Dr
- 2498 E Santa Paula Dr
- 145 S Poplar Ave Unit 20
- 38 Rogers Ct
- 149 Bluegrass St
- 878 N Landa Way
- 3054 Associated Rd Unit 20
- 127 S Redwood Ave
- 162 Waterfall Ln
- 150 Waterfall Ln
- 153 Meadowcreek Rd
- 144 Waterfall Ln
- 168 Waterfall Ln
- 147 Meadowcreek Rd
- 159 Meadowcreek Rd
- 138 Waterfall Ln
- 157 Waterfall Ln
- 151 Waterfall Ln
- 145 Waterfall Ln
- 141 Meadowcreek Rd
- 163 Waterfall Ln
- 139 Waterfall Ln
- 169 Waterfall Ln
- 135 Meadowcreek Rd
- 175 Waterfall Ln
- 160 Brookside Ln
- 154 Brookside Ln
- 158 Meadowcreek Rd
Your Personal Tour Guide
Ask me questions while you tour the home.