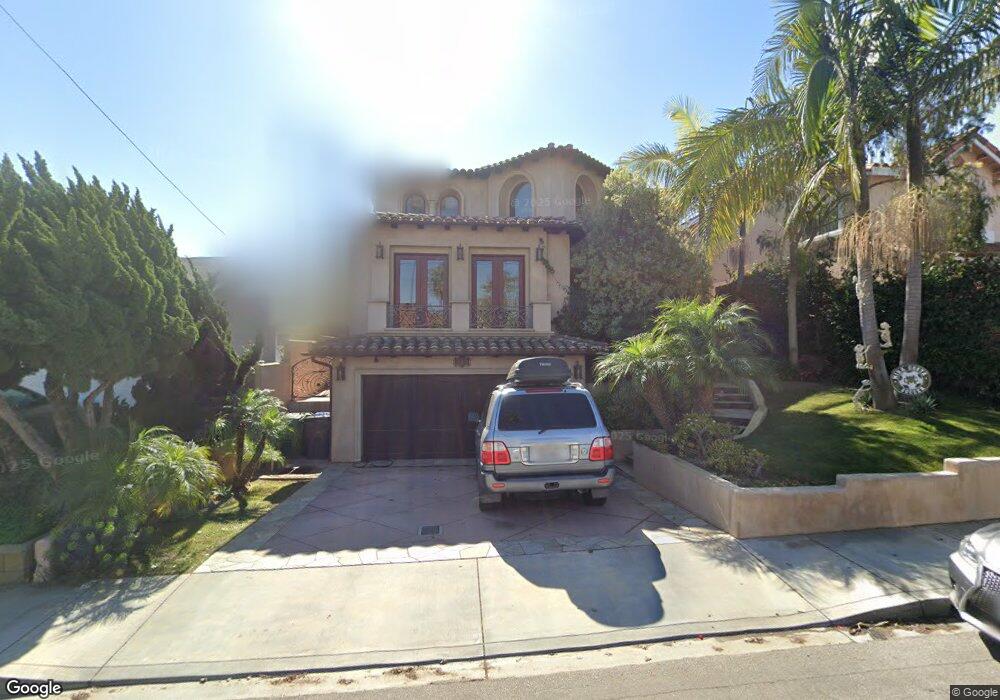
1560 Gates Ave Manhattan Beach, CA 90266
Estimated Value: $4,660,203 - $5,394,000
5
Beds
8
Baths
5,404
Sq Ft
$952/Sq Ft
Est. Value
About This Home
This home is located at 1560 Gates Ave, Manhattan Beach, CA 90266 and is currently estimated at $5,142,801, approximately $951 per square foot. 1560 Gates Ave is a home located in Los Angeles County with nearby schools including Aurelia Pennekamp Elementary School, Manhattan Beach Middle School, and Mira Costa High School.
Ownership History
Date
Name
Owned For
Owner Type
Purchase Details
Closed on
Sep 26, 2008
Sold by
Liang David
Bought by
Arnson Todd Bennett
Current Estimated Value
Home Financials for this Owner
Home Financials are based on the most recent Mortgage that was taken out on this home.
Original Mortgage
$1,000,000
Interest Rate
6.5%
Mortgage Type
Purchase Money Mortgage
Purchase Details
Closed on
Dec 13, 2006
Sold by
Cordray James E and Cordray Christine A
Bought by
Liang David
Purchase Details
Closed on
Dec 5, 2002
Sold by
Cordray James E
Bought by
Cordray James E
Purchase Details
Closed on
Apr 23, 2002
Sold by
Cordray James E and The J Marie Cordray Living Tru
Bought by
Cordray James E
Purchase Details
Closed on
Sep 24, 2001
Sold by
Cordray Jimmie Marie
Bought by
Cordray J Marie and The J Marie Cordray Living Trust
Create a Home Valuation Report for This Property
The Home Valuation Report is an in-depth analysis detailing your home's value as well as a comparison with similar homes in the area
Home Values in the Area
Average Home Value in this Area
Purchase History
| Date | Buyer | Sale Price | Title Company |
|---|---|---|---|
| Arnson Todd Bennett | $2,475,000 | Chicago Title Company | |
| Liang David | $1,075,000 | Chicago Title Co | |
| Cordray James E | -- | -- | |
| Cordray James E | -- | -- | |
| Cordray J Marie | -- | -- |
Source: Public Records
Mortgage History
| Date | Status | Borrower | Loan Amount |
|---|---|---|---|
| Previous Owner | Arnson Todd Bennett | $1,000,000 |
Source: Public Records
Tax History Compared to Growth
Tax History
| Year | Tax Paid | Tax Assessment Tax Assessment Total Assessment is a certain percentage of the fair market value that is determined by local assessors to be the total taxable value of land and additions on the property. | Land | Improvement |
|---|---|---|---|---|
| 2025 | $35,989 | $3,187,202 | $1,487,360 | $1,699,842 |
| 2024 | $35,989 | $3,124,709 | $1,458,197 | $1,666,512 |
| 2023 | $34,961 | $3,063,441 | $1,429,605 | $1,633,836 |
| 2022 | $34,356 | $3,003,374 | $1,401,574 | $1,601,800 |
| 2021 | $33,715 | $2,944,486 | $1,374,093 | $1,570,393 |
| 2019 | $32,810 | $2,857,153 | $1,333,338 | $1,523,815 |
| 2018 | $32,110 | $2,801,132 | $1,307,195 | $1,493,937 |
| 2016 | $29,925 | $2,692,363 | $1,256,436 | $1,435,927 |
| 2015 | $29,306 | $2,651,923 | $1,237,564 | $1,414,359 |
| 2014 | $26,410 | $2,373,000 | $1,622,900 | $750,100 |
Source: Public Records
Map
Nearby Homes
- 1500 2nd St
- 1643 3rd St
- 207 S Aviation Blvd
- 1902 Gates Ave
- 1756 Ruhland Ave
- 2406 Aviation Blvd Unit C
- 2700 Aviation Blvd
- 615 Aviation Way
- 1752 Carver St
- 1752 Dixon St
- 1758 Reed St
- 1906 Plant Ave
- 1742 Reed St
- 1757 8th St
- 1760 9th St
- 1816 9th St
- 1820 9th St
- 1711 Axenty Way
- 2021 Curtis Ave
- 2005 Mathews Ave Unit C
- 1562 Gates Ave
- 1550 Gates Ave
- 1544 Gates Ave
- 1600 Gates Ave
- 208 S Herrin Ave
- 1555 Curtis Ave
- 1540 Gates Ave
- 1551 Curtis Ave
- 1561 Gates Ave
- 1551 Gates Ave
- 1606 Gates Ave
- 1534 Gates Ave
- 1545 Curtis Ave
- 1601 Curtis Ave
- 1545 Gates Ave
- 1601 Gates Ave
- 117 S Herrin Ave
- 1541 Gates Ave
- 1535 Curtis Ave
- 1607 Curtis Ave