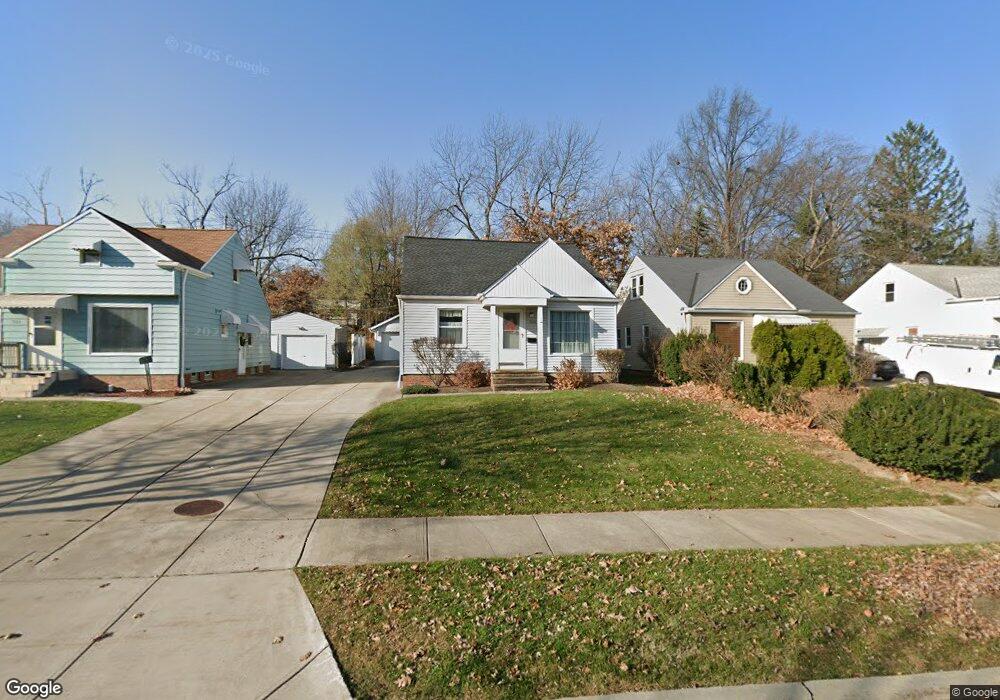
1560 Maplegrove Rd Cleveland, OH 44121
Estimated Value: $139,000 - $175,000
2
Beds
1
Bath
1,326
Sq Ft
$118/Sq Ft
Est. Value
About This Home
This home is located at 1560 Maplegrove Rd, Cleveland, OH 44121 and is currently estimated at $156,109, approximately $117 per square foot. 1560 Maplegrove Rd is a home located in Cuyahoga County with nearby schools including Rowland Elementary School, Greenview Upper Elementary School, and Memorial Junior High School.
Ownership History
Date
Name
Owned For
Owner Type
Purchase Details
Closed on
Sep 24, 1997
Sold by
Keleman Joseph N
Bought by
Caroscio Sharon A
Current Estimated Value
Home Financials for this Owner
Home Financials are based on the most recent Mortgage that was taken out on this home.
Original Mortgage
$65,200
Outstanding Balance
$10,641
Interest Rate
7.63%
Mortgage Type
New Conventional
Estimated Equity
$145,468
Purchase Details
Closed on
Feb 12, 1993
Sold by
Fisher Robert A and Fisher Rosena R
Bought by
Keleman Joseph
Purchase Details
Closed on
Dec 1, 1986
Sold by
Carey Joseph A
Bought by
Fisher Robert A and Fisher Rosena R
Purchase Details
Closed on
Jan 13, 1986
Sold by
Kleinman Joe
Bought by
Carey Joseph A
Purchase Details
Closed on
Sep 3, 1976
Sold by
Kleinman Joe and Kleinman Gertrude S
Bought by
Kleinman Joe
Purchase Details
Closed on
Jan 1, 1975
Bought by
Kleinman Joe and Kleinman Gertrude S
Create a Home Valuation Report for This Property
The Home Valuation Report is an in-depth analysis detailing your home's value as well as a comparison with similar homes in the area
Home Values in the Area
Average Home Value in this Area
Purchase History
| Date | Buyer | Sale Price | Title Company |
|---|---|---|---|
| Caroscio Sharon A | $81,500 | -- | |
| Keleman Joseph | $42,800 | -- | |
| Fisher Robert A | $45,000 | -- | |
| Carey Joseph A | $44,000 | -- | |
| Kleinman Joe | -- | -- | |
| Kleinman Joe | -- | -- |
Source: Public Records
Mortgage History
| Date | Status | Borrower | Loan Amount |
|---|---|---|---|
| Open | Caroscio Sharon A | $65,200 |
Source: Public Records
Tax History Compared to Growth
Tax History
| Year | Tax Paid | Tax Assessment Tax Assessment Total Assessment is a certain percentage of the fair market value that is determined by local assessors to be the total taxable value of land and additions on the property. | Land | Improvement |
|---|---|---|---|---|
| 2024 | $3,712 | $47,845 | $9,275 | $38,570 |
| 2023 | $3,307 | $34,340 | $7,420 | $26,920 |
| 2022 | $3,290 | $34,335 | $7,420 | $26,915 |
| 2021 | $3,264 | $34,340 | $7,420 | $26,920 |
| 2020 | $3,226 | $29,610 | $6,410 | $23,210 |
| 2019 | $2,949 | $84,600 | $18,300 | $66,300 |
| 2018 | $2,942 | $29,610 | $6,410 | $23,210 |
| 2017 | $3,039 | $28,220 | $5,290 | $22,930 |
| 2016 | $3,020 | $28,220 | $5,290 | $22,930 |
| 2015 | $3,070 | $28,220 | $5,290 | $22,930 |
| 2014 | $3,070 | $29,690 | $5,570 | $24,120 |
Source: Public Records
Map
Nearby Homes
- 1528 Felton Rd
- 1533 Holmden Rd
- 1606 Laclede Rd
- 1572 Holmden Rd
- 1605 Laclede Rd
- 1494 Laclede Rd
- 1519 Laclede Rd
- 4154 Bexley Blvd
- 4201 Lambert Rd
- 1477 Genesee Rd
- 0 S Belvoir Blvd Unit 5096678
- 1400 Avondale Rd
- 1391 Avondale Rd
- 1539 Sheffield Rd
- 1727 Warrensville Center Rd
- 1400 Francis Ct
- 4121 Hinsdale Rd
- 1356 Plainfield Rd
- 1779 Warrensville Center Rd
- 1514 Garden Dr
- 1556 Maplegrove Rd
- 1564 Maplegrove Rd
- 1552 Maplegrove Rd
- 1572 Maplegrove Rd
- 1548 Maplegrove Rd
- 1576 Maplegrove Rd
- 1565 Felton Rd
- 1567 Felton Rd
- 1544 Maplegrove Rd
- 1555 Felton Rd
- 1582 Maplegrove Rd
- 1571 Felton Rd
- 1563 Maplegrove Rd
- 1567 Maplegrove Rd
- 1551 Felton Rd
- 1557 Maplegrove Rd
- 1573 Maplegrove Rd
- 1540 Maplegrove Rd
- 1575 Felton Rd
- 1553 Maplegrove Rd