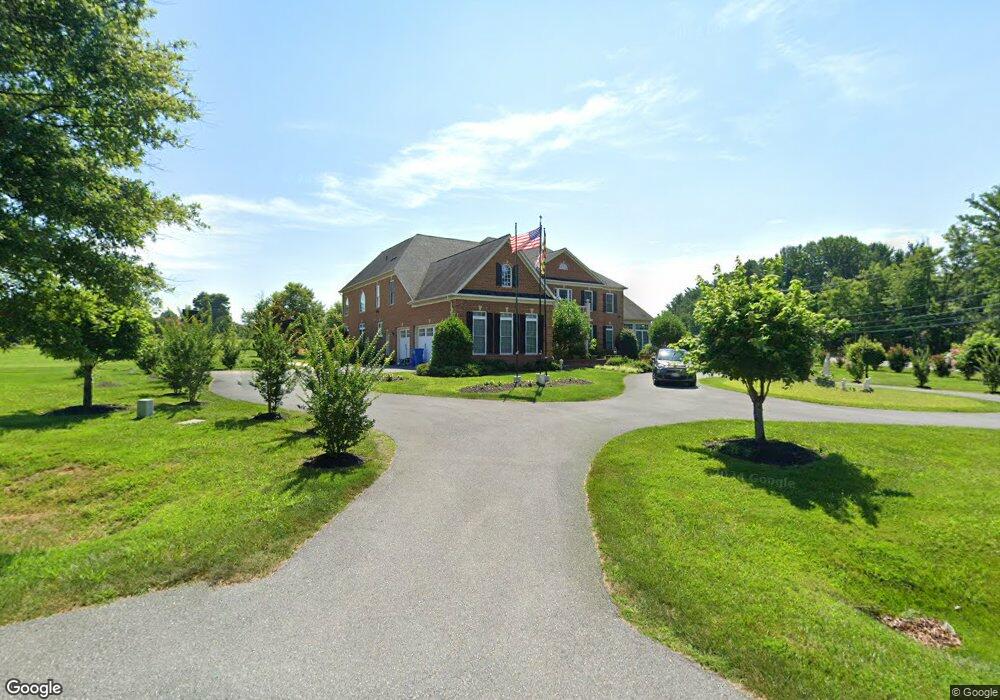
15601 Crimson Spire Ct Silver Spring, MD 20905
Estimated Value: $1,135,000 - $1,943,000
5
Beds
6
Baths
6,374
Sq Ft
$256/Sq Ft
Est. Value
About This Home
This home is located at 15601 Crimson Spire Ct, Silver Spring, MD 20905 and is currently estimated at $1,634,179, approximately $256 per square foot. 15601 Crimson Spire Ct is a home located in Montgomery County with nearby schools including Stonegate Elementary School, White Oak Middle School, and James Hubert Blake High School.
Ownership History
Date
Name
Owned For
Owner Type
Purchase Details
Closed on
Apr 8, 2009
Sold by
Baddelilyanage Sunil M
Bought by
Varghese Leelamma
Current Estimated Value
Purchase Details
Closed on
Mar 9, 2007
Sold by
Nvr Inc
Bought by
Baddelilyanage Sunil M
Home Financials for this Owner
Home Financials are based on the most recent Mortgage that was taken out on this home.
Original Mortgage
$360,000
Interest Rate
6.4%
Mortgage Type
Stand Alone Second
Purchase Details
Closed on
Feb 27, 2007
Sold by
Nvr Inc
Bought by
Baddelilyanage Sunil M
Home Financials for this Owner
Home Financials are based on the most recent Mortgage that was taken out on this home.
Original Mortgage
$360,000
Interest Rate
6.4%
Mortgage Type
Stand Alone Second
Purchase Details
Closed on
Jun 21, 2006
Sold by
Mtr Hill Llc
Bought by
Nvr Inc
Purchase Details
Closed on
May 25, 2006
Sold by
Mtr Hill Llc
Bought by
Nvr Inc
Create a Home Valuation Report for This Property
The Home Valuation Report is an in-depth analysis detailing your home's value as well as a comparison with similar homes in the area
Home Values in the Area
Average Home Value in this Area
Purchase History
| Date | Buyer | Sale Price | Title Company |
|---|---|---|---|
| Varghese Leelamma | $1,060,000 | -- | |
| Baddelilyanage Sunil M | $1,800,000 | -- | |
| Baddelilyanage Sunil M | $1,800,000 | -- | |
| Nvr Inc | $675,000 | -- | |
| Nvr Inc | $675,000 | -- |
Source: Public Records
Mortgage History
| Date | Status | Borrower | Loan Amount |
|---|---|---|---|
| Previous Owner | Baddelilyanage Sunil M | $360,000 | |
| Previous Owner | Baddelilyanage Sunil M | $1,350,000 | |
| Previous Owner | Baddelilyanage Sunil M | $1,350,000 |
Source: Public Records
Tax History Compared to Growth
Tax History
| Year | Tax Paid | Tax Assessment Tax Assessment Total Assessment is a certain percentage of the fair market value that is determined by local assessors to be the total taxable value of land and additions on the property. | Land | Improvement |
|---|---|---|---|---|
| 2025 | $16,908 | $1,563,033 | -- | -- |
| 2024 | $16,908 | $1,406,167 | $0 | $0 |
| 2023 | $14,374 | $1,249,300 | $299,700 | $949,600 |
| 2022 | $13,250 | $1,204,800 | $0 | $0 |
| 2021 | $12,163 | $1,160,300 | $0 | $0 |
| 2020 | $12,163 | $1,115,800 | $333,100 | $782,700 |
| 2019 | $12,138 | $1,115,800 | $333,100 | $782,700 |
| 2018 | $12,152 | $1,115,800 | $333,100 | $782,700 |
| 2017 | $12,622 | $1,137,500 | $0 | $0 |
| 2016 | $16,487 | $1,061,867 | $0 | $0 |
| 2015 | $16,487 | $986,233 | $0 | $0 |
| 2014 | $16,487 | $910,600 | $0 | $0 |
Source: Public Records
Map
Nearby Homes
- 209 Farmgate Ln
- 15315 Holly Grove Rd
- 401 Bryants Nursery Rd
- 15222 Centergate Dr
- 15205 Rockport Dr
- 15104 Winstead Ln
- 550 Bryants Nursery Rd
- 15108 Watergate Rd
- 409 Carona Place
- 14938 Wellwood Rd
- 302 Notley Ct
- 225 Windridge Acres Ct
- 416 Marshall Manor Dr
- 703 Mcneil Ln
- 16212 Old Orchard Rd
- 14908 Cobblestone Dr
- 415 Firestone Dr
- 15801 New Hampshire Ave
- 202 Piping Rock Dr
- 14701 Notley Rd
- 113 Norwood Rd
- 137 Norwood Rd
- 15600 Crimson Spire Ct
- 140 Norwood Rd
- 15603 Crimson Spire Ct
- 126 Norwood Rd
- 115 Norwood Rd
- 175 Norwood Rd
- 15602 Crimson Spire Ct
- 160 Norwood Rd
- 129 Norwood Rd
- 150 Norwood Rd
- 114 Norwood Rd
- 15601 Holly Grove Rd
- 133 Norwood Rd
- 105 Norwood Rd
- 170 Norwood Rd
- 111 Norwood Rd
- 15605 Crimson Spire Ct
- 15613 Holly Grove Rd