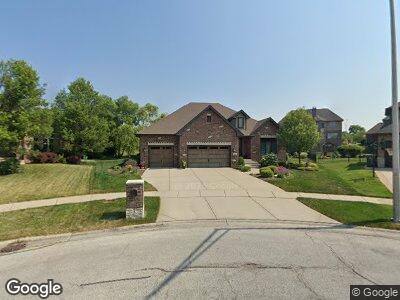
15601 Heatherglen Ct Orland Park, IL 60462
Centennial NeighborhoodEstimated Value: $611,000 - $744,000
3
Beds
3
Baths
2,567
Sq Ft
$261/Sq Ft
Est. Value
About This Home
This home is located at 15601 Heatherglen Ct, Orland Park, IL 60462 and is currently estimated at $669,779, approximately $260 per square foot. 15601 Heatherglen Ct is a home located in Cook County with nearby schools including Centennial School, Meadow Ridge School, and Century Junior High School.
Ownership History
Date
Name
Owned For
Owner Type
Purchase Details
Closed on
Jul 25, 2017
Sold by
Grob William J and Grob Laura M
Bought by
Grob William J and Grob Laura M
Current Estimated Value
Purchase Details
Closed on
Nov 18, 2013
Sold by
Wheeler Financial Inc
Bought by
Grob William and Grob Laura
Purchase Details
Closed on
Oct 4, 2013
Sold by
Cook County Clerk
Bought by
Wheeler Financial Inc
Purchase Details
Closed on
Jan 5, 2007
Sold by
Standard Bank & Trust Co
Bought by
Kaczmarek Richard D and Kaczmarek Margaret
Home Financials for this Owner
Home Financials are based on the most recent Mortgage that was taken out on this home.
Original Mortgage
$196,000
Interest Rate
6.21%
Mortgage Type
Unknown
Purchase Details
Closed on
Aug 26, 2004
Sold by
Colette Highlands Llc
Bought by
Standard Bank & Trust Co and Trust #17115
Create a Home Valuation Report for This Property
The Home Valuation Report is an in-depth analysis detailing your home's value as well as a comparison with similar homes in the area
Home Values in the Area
Average Home Value in this Area
Purchase History
| Date | Buyer | Sale Price | Title Company |
|---|---|---|---|
| Grob William J | -- | Attorney | |
| Grob William | -- | First American | |
| Wheeler Financial Inc | -- | None Available | |
| Kaczmarek Richard D | $280,000 | Cti | |
| Standard Bank & Trust Co | $1,920,000 | Cti |
Source: Public Records
Mortgage History
| Date | Status | Borrower | Loan Amount |
|---|---|---|---|
| Open | Grob William J | $36,800 | |
| Open | Grob William | $375,000 | |
| Previous Owner | Kaczmarek Richard D | $196,000 |
Source: Public Records
Tax History Compared to Growth
Tax History
| Year | Tax Paid | Tax Assessment Tax Assessment Total Assessment is a certain percentage of the fair market value that is determined by local assessors to be the total taxable value of land and additions on the property. | Land | Improvement |
|---|---|---|---|---|
| 2024 | $9,764 | $58,165 | $9,597 | $48,568 |
| 2023 | $9,764 | $58,165 | $9,597 | $48,568 |
| 2022 | $9,764 | $36,015 | $8,317 | $27,698 |
| 2021 | $9,456 | $36,014 | $8,317 | $27,697 |
| 2020 | $9,165 | $36,014 | $8,317 | $27,697 |
| 2019 | $10,784 | $42,716 | $7,677 | $35,039 |
| 2018 | $10,486 | $42,716 | $7,677 | $35,039 |
| 2017 | $11,236 | $46,439 | $7,677 | $38,762 |
| 2016 | $13,255 | $50,000 | $7,037 | $42,963 |
| 2015 | $10,489 | $37,954 | $7,037 | $30,917 |
| 2014 | $1,916 | $7,037 | $7,037 | $0 |
| 2013 | $1,804 | $7,037 | $7,037 | $0 |
Source: Public Records
Map
Nearby Homes
- 10801 Jillian Rd
- 10821 Jillian Rd
- 10609 Owain Way
- 10607 Paige Cir
- 10649 Gabrielle Ln
- 10651 Gabrielle Ln
- 15753 Scotsglen Rd
- 15810 Scotsglen Rd
- 15760 108th Ave
- 15391 Silver Bell Rd
- 10855 W 153rd St
- 11150 Shenandoah Dr
- 15125 Penrose Ct
- 15245 Penrose Ct
- 15150 109th Ave
- 15603 112th Ct
- 11155 Lizmore Ln Unit 35B
- 11060 Lizmore Ln Unit 27B
- 11240 W 159th St
- 156 113th Ct
- 15601 Heatherglen Ct
- 15609 Heatherglen Ct
- 15603 Heatherglen Ct
- 15540 Scotsglen Rd
- 15548 Scotsglen Rd
- 15600 Heatherglen Ct
- 15556 Scotsglen Rd
- 15617 Heatherglen Ct
- 15532 Scotsglen Rd
- 15608 Heatherglen Ct
- 15564 Scotsglen Rd
- 15601 108th Ave
- 15616 Heatherglen Ct
- 15600 Scotsglen Rd
- 15524 Scotsglen Rd
- 15603 108th Ave
- 15545 Scotsglen Rd
- 15533 Scotsglen Rd
- 10701 Bonnieglen Place
- 15633 Heatherglen Dr