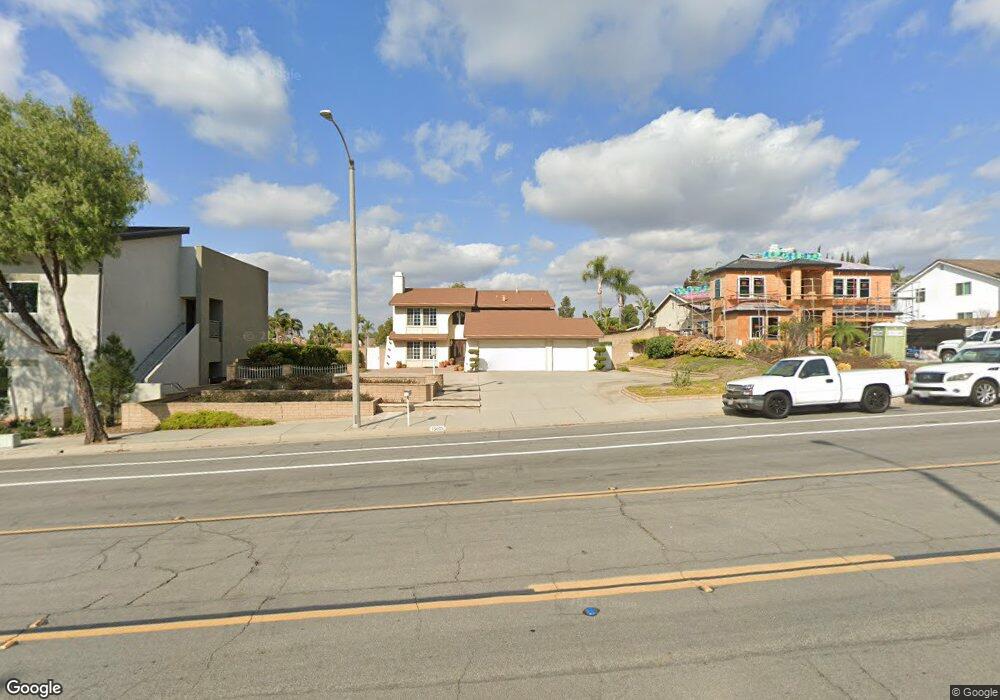
15603 Foster Rd La Mirada, CA 90638
Estimated Value: $1,148,000 - $1,390,000
4
Beds
3
Baths
2,184
Sq Ft
$575/Sq Ft
Est. Value
About This Home
This home is located at 15603 Foster Rd, La Mirada, CA 90638 and is currently estimated at $1,255,100, approximately $574 per square foot. 15603 Foster Rd is a home located in Los Angeles County with nearby schools including John Foster Dulles Elementary School, Reginald M. Benton Middle School, and La Mirada High School.
Ownership History
Date
Name
Owned For
Owner Type
Purchase Details
Closed on
Sep 2, 2020
Sold by
Perez Rosalio A and Perez Priscilla T
Bought by
Perez Rosalio A and Perez Priscilla T
Current Estimated Value
Home Financials for this Owner
Home Financials are based on the most recent Mortgage that was taken out on this home.
Original Mortgage
$178,675
Interest Rate
2.8%
Mortgage Type
New Conventional
Purchase Details
Closed on
Aug 19, 2013
Sold by
Perez Rosalio A
Bought by
Perez Rosalio A and Perez Priscilla T
Purchase Details
Closed on
Mar 25, 2013
Sold by
Perez Rosalio Agua and Perez Priscilla Tavera
Bought by
Perez Rosalio Agua and Perez Priscilla Tavera
Home Financials for this Owner
Home Financials are based on the most recent Mortgage that was taken out on this home.
Original Mortgage
$291,000
Interest Rate
3.49%
Mortgage Type
New Conventional
Create a Home Valuation Report for This Property
The Home Valuation Report is an in-depth analysis detailing your home's value as well as a comparison with similar homes in the area
Home Values in the Area
Average Home Value in this Area
Purchase History
| Date | Buyer | Sale Price | Title Company |
|---|---|---|---|
| Perez Rosalio A | -- | Amrock Inc | |
| Perez Rosalio A | -- | Amrock Inc | |
| Perez Rosalio A | -- | None Available | |
| Perez Rosalio Agua | -- | Lsi |
Source: Public Records
Mortgage History
| Date | Status | Borrower | Loan Amount |
|---|---|---|---|
| Closed | Perez Rosalio A | $178,675 | |
| Closed | Perez Rosalio Agua | $291,000 |
Source: Public Records
Tax History Compared to Growth
Tax History
| Year | Tax Paid | Tax Assessment Tax Assessment Total Assessment is a certain percentage of the fair market value that is determined by local assessors to be the total taxable value of land and additions on the property. | Land | Improvement |
|---|---|---|---|---|
| 2025 | $4,555 | $332,828 | $111,008 | $221,820 |
| 2024 | $4,555 | $326,303 | $108,832 | $217,471 |
| 2023 | $4,409 | $319,906 | $106,699 | $213,207 |
| 2022 | $4,333 | $313,634 | $104,607 | $209,027 |
| 2021 | $4,266 | $307,485 | $102,556 | $204,929 |
| 2020 | $4,166 | $304,333 | $101,505 | $202,828 |
| 2019 | $4,148 | $298,366 | $99,515 | $198,851 |
| 2018 | $3,829 | $292,516 | $97,564 | $194,952 |
| 2016 | $3,656 | $281,159 | $93,776 | $187,383 |
| 2015 | $3,626 | $276,937 | $92,368 | $184,569 |
| 2014 | $3,387 | $271,513 | $90,559 | $180,954 |
Source: Public Records
Map
Nearby Homes
- 15420 Olive Branch Dr
- 13210 Avenida Socorro
- 13212 La Jolla Cir Unit 307-B
- 13115 Avenida Santa Tecla Unit 311-A
- 13526 La Jolla Cir Unit 207-D
- 13644 La Jolla Cir Unit 14B
- 13624 La Jolla Cir Unit F
- 13515 Avenida Santa Tecla Unit 210D
- 13556 La Jolla Cir Unit 208H
- 13602 La Jolla Cir Unit B
- 15856 Lawnhill Dr
- 12604 Oxford Dr
- 15960 Glazebrook Dr
- 15920 Alta Vista Dr Unit 2-C
- 15816 La Pena Ave
- 12817 Meadow Green Rd
- 14006 Las Puertas St
- 14111 El Mirador St
- 13220 Fonseca Ave
- 12406 Clearglen Ave
- 15611 Foster Rd
- 13140 Stern Ave
- 15619 Foster Rd
- 13138 Stern Ave
- 13142 Stern Ave
- 15627 Foster Rd
- 13146 Stern Ave
- 13150 Stern Ave
- 13134 Stern Ave
- 15568 Carrington Dr
- 15631 Foster Rd
- 13219 Stern Ave
- 13130 Stern Ave
- 15633 Foster Rd
- 13227 Stern Ave
- 15560 Carrington Dr
- 15569 Carrington Dr
- 13129 Stern Ave
- 13127 Stern Ave
- 13126 Stern Ave