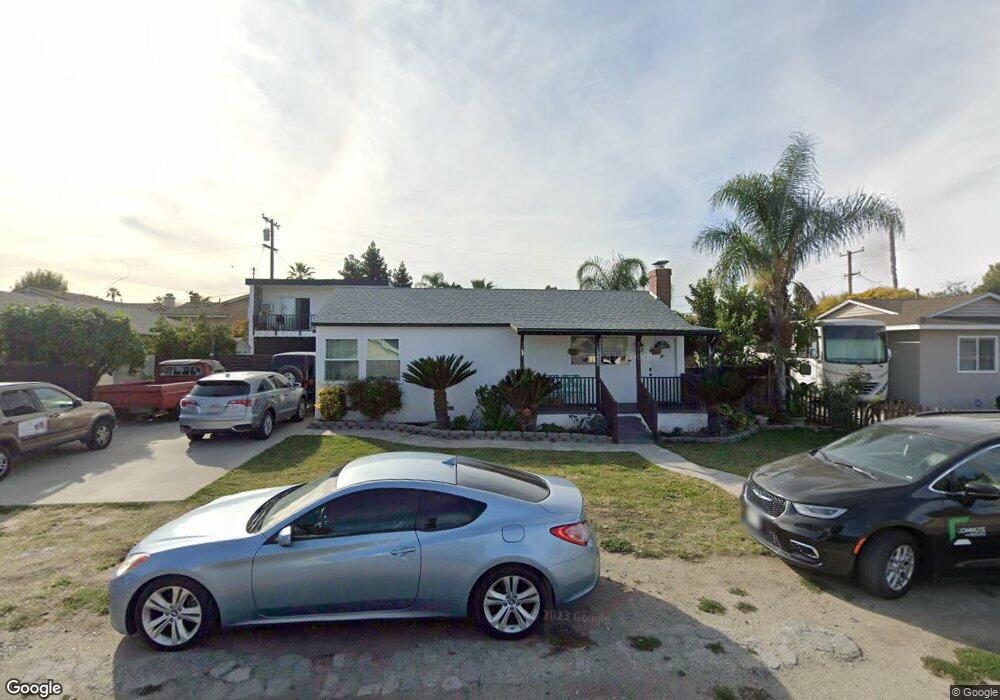
15608 Esther St Chino Hills, CA 91709
Los Serranos NeighborhoodEstimated Value: $694,000 - $830,000
3
Beds
2
Baths
1,710
Sq Ft
$454/Sq Ft
Est. Value
About This Home
This home is located at 15608 Esther St, Chino Hills, CA 91709 and is currently estimated at $777,134, approximately $454 per square foot. 15608 Esther St is a home located in San Bernardino County with nearby schools including Chaparral Elementary School, Robert O. Townsend Junior High School, and Chino Hills High School.
Ownership History
Date
Name
Owned For
Owner Type
Purchase Details
Closed on
Mar 26, 2010
Sold by
Bedre Richard M
Bought by
Hernandez Jorge Luis and Velazquez Adriana
Current Estimated Value
Home Financials for this Owner
Home Financials are based on the most recent Mortgage that was taken out on this home.
Original Mortgage
$299,475
Outstanding Balance
$201,915
Interest Rate
5.25%
Mortgage Type
FHA
Estimated Equity
$575,219
Purchase Details
Closed on
Jun 26, 2002
Sold by
Bedre Richard
Bought by
Bedre Richard M and Bedre Deborah J
Purchase Details
Closed on
Jun 1, 1999
Sold by
Buckley James M
Bought by
Bedre Richard and Bedre Deborah
Home Financials for this Owner
Home Financials are based on the most recent Mortgage that was taken out on this home.
Original Mortgage
$135,150
Interest Rate
7.05%
Mortgage Type
VA
Create a Home Valuation Report for This Property
The Home Valuation Report is an in-depth analysis detailing your home's value as well as a comparison with similar homes in the area
Home Values in the Area
Average Home Value in this Area
Purchase History
| Date | Buyer | Sale Price | Title Company |
|---|---|---|---|
| Hernandez Jorge Luis | $305,000 | Lawyers Title | |
| Bedre Richard M | -- | -- | |
| Bedre Richard | $134,000 | Fidelity National Title Ins |
Source: Public Records
Mortgage History
| Date | Status | Borrower | Loan Amount |
|---|---|---|---|
| Open | Hernandez Jorge Luis | $299,475 | |
| Previous Owner | Bedre Richard | $135,150 |
Source: Public Records
Tax History Compared to Growth
Tax History
| Year | Tax Paid | Tax Assessment Tax Assessment Total Assessment is a certain percentage of the fair market value that is determined by local assessors to be the total taxable value of land and additions on the property. | Land | Improvement |
|---|---|---|---|---|
| 2025 | $4,307 | $393,699 | $138,117 | $255,582 |
| 2024 | $4,307 | $385,980 | $135,409 | $250,571 |
| 2023 | $4,235 | $378,412 | $132,754 | $245,658 |
| 2022 | $4,208 | $370,992 | $130,151 | $240,841 |
| 2021 | $4,127 | $363,718 | $127,599 | $236,119 |
| 2020 | $4,075 | $359,989 | $126,291 | $233,698 |
| 2019 | $4,004 | $352,931 | $123,815 | $229,116 |
| 2018 | $3,918 | $346,011 | $121,387 | $224,624 |
| 2017 | $3,792 | $339,227 | $119,007 | $220,220 |
| 2016 | $3,544 | $332,576 | $116,674 | $215,902 |
| 2015 | $3,473 | $327,580 | $114,921 | $212,659 |
| 2014 | $3,405 | $321,163 | $112,670 | $208,493 |
Source: Public Records
Map
Nearby Homes
- 15508 Quail St
- 4718 El Molino Ln
- 15849 Tanberry Dr
- 15892 Tanberry Dr
- 15366 Carmelita Ave
- 5165 Pomona Rincon Rd
- 15239 Murray Ave
- 5177 Pomona Rincon Rd
- 4441 Los Serranos Blvd
- 15906 Kingston Rd
- 15920 Ellington Way
- 15946 Ellington Way
- 15841 Ellington Way
- 4407 Lilac Cir
- 15224 Mariposa Ave
- 4424 Lilac Cir
- 15111 Pipeline Ave Unit 64
- 15111 Pipeline Ave Unit 274
- 15111 Pipeline Ave Unit 158
- 15111 Pipeline Ave Unit 281
- 15610 Esther St
- 15604 Esther St
- 15618 Esther St
- 15617 Yorba Ave
- 15611 Yorba Ave
- 15627 Yorba Ave
- 15603 Yorba Ave
- 15580 Esther St
- 15605 Esther St
- 15639 Yorba Ave
- 15609 Esther St
- 15597 Yorba Ave
- 15593 Esther St
- 15621 Esther St
- 15643 Yorba Ave
- 15642 Esther St
- 15625 Esther St
- 15587 Yorba Ave
- 15651 Yorba Ave
- 15573 Esther St