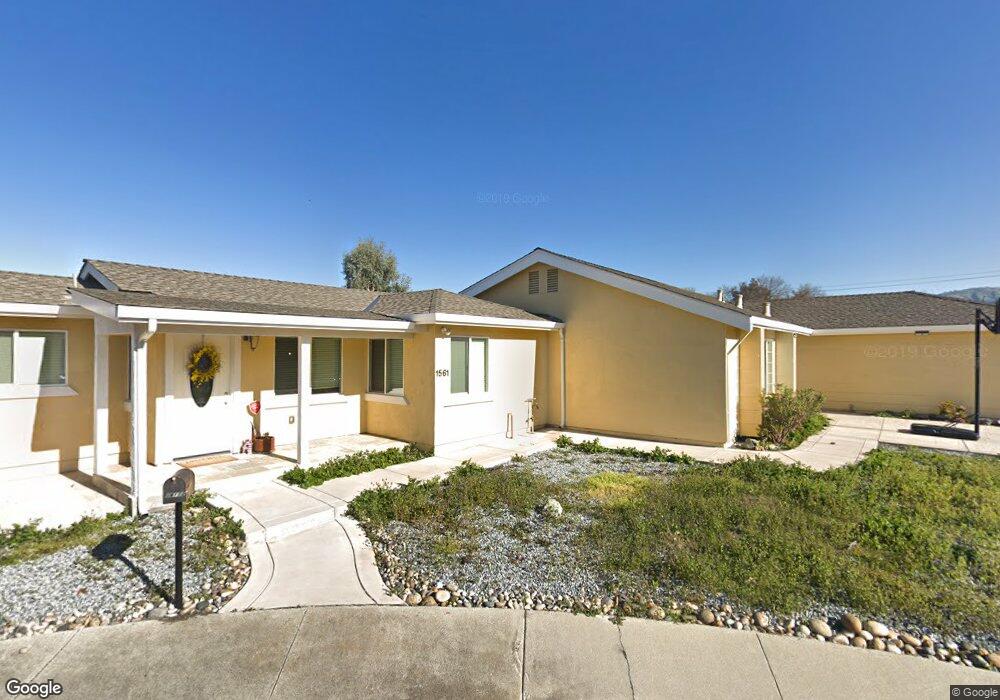
1561 Via Alegria Ct San Jose, CA 95121
Dove Hill NeighborhoodEstimated Value: $1,234,000 - $1,403,000
3
Beds
2
Baths
1,220
Sq Ft
$1,059/Sq Ft
Est. Value
About This Home
This home is located at 1561 Via Alegria Ct, San Jose, CA 95121 and is currently estimated at $1,292,235, approximately $1,059 per square foot. 1561 Via Alegria Ct is a home located in Santa Clara County with nearby schools including John J. Montgomery Elementary School, George V. Leyva Intermediate School, and Silver Creek High School.
Ownership History
Date
Name
Owned For
Owner Type
Purchase Details
Closed on
Oct 20, 2018
Sold by
Cao Thomas D and Nguyen Jessica Ngoc
Bought by
Cao Thomas D and Nguyen Jessica Ngoc
Current Estimated Value
Purchase Details
Closed on
Nov 4, 2008
Sold by
Wells Fargo Bank National Association
Bought by
Cao Thomas D and Nguyen Jessica Ngoc
Home Financials for this Owner
Home Financials are based on the most recent Mortgage that was taken out on this home.
Original Mortgage
$200,000
Interest Rate
5.9%
Mortgage Type
Seller Take Back
Purchase Details
Closed on
Aug 8, 2008
Sold by
Muensri Kanitha
Bought by
Wells Fargo Bank Na
Purchase Details
Closed on
Sep 9, 2005
Sold by
Soucy Robert H
Bought by
Muensri Kanitha
Home Financials for this Owner
Home Financials are based on the most recent Mortgage that was taken out on this home.
Original Mortgage
$66,500
Interest Rate
5.81%
Mortgage Type
Credit Line Revolving
Purchase Details
Closed on
Jul 1, 1998
Sold by
Soucy Robert H
Bought by
Soucy Robert H
Create a Home Valuation Report for This Property
The Home Valuation Report is an in-depth analysis detailing your home's value as well as a comparison with similar homes in the area
Home Values in the Area
Average Home Value in this Area
Purchase History
| Date | Buyer | Sale Price | Title Company |
|---|---|---|---|
| Cao Thomas D | -- | None Available | |
| Cao Thomas D | $420,000 | Chicago Title Company | |
| Wells Fargo Bank Na | $332,715 | None Available | |
| Muensri Kanitha | $665,000 | Alliance Title Company | |
| Soucy Robert H | -- | -- |
Source: Public Records
Mortgage History
| Date | Status | Borrower | Loan Amount |
|---|---|---|---|
| Previous Owner | Cao Thomas D | $200,000 | |
| Previous Owner | Muensri Kanitha | $66,500 | |
| Previous Owner | Muensri Kanitha | $532,000 |
Source: Public Records
Tax History Compared to Growth
Tax History
| Year | Tax Paid | Tax Assessment Tax Assessment Total Assessment is a certain percentage of the fair market value that is determined by local assessors to be the total taxable value of land and additions on the property. | Land | Improvement |
|---|---|---|---|---|
| 2025 | $10,722 | $667,350 | $324,509 | $342,841 |
| 2024 | $10,722 | $654,266 | $318,147 | $336,119 |
| 2023 | $10,570 | $641,438 | $311,909 | $329,529 |
| 2022 | $10,501 | $628,862 | $305,794 | $323,068 |
| 2021 | $10,262 | $616,533 | $299,799 | $316,734 |
| 2020 | $9,767 | $610,212 | $296,725 | $313,487 |
| 2019 | $9,490 | $598,248 | $290,907 | $307,341 |
| 2018 | $9,373 | $586,518 | $285,203 | $301,315 |
| 2017 | $9,215 | $575,018 | $279,611 | $295,407 |
| 2016 | $7,060 | $456,881 | $274,129 | $182,752 |
| 2015 | $6,823 | $450,019 | $270,012 | $180,007 |
| 2014 | $6,211 | $441,204 | $264,723 | $176,481 |
Source: Public Records
Map
Nearby Homes
- 3463 Sugarcreek Ct
- 3699 Cedar Knoll Ct
- 3826 Carryduff Way
- 1520 E Capitol Expy
- 1520 E Capitol Expy Unit 29
- 3262 Firth Way
- 3789 Ashridge Ln
- 1868 Bagpipe Way
- 3326 Shadow Park Place
- 3241 Shadow Park Place
- 2114 Bennighof Ct
- 1250 Medley Dr
- 3910 Edenwood Dr
- 3016 Shadow Springs Place Unit 113
- 1188 Alvernaz Dr
- 2176 Laddie Ct
- 3255 Pomeroy Ave
- 3248 Rocky Water Ln
- 1317 Bilbo Ct
- 3843 Marfrance Dr
- 1567 Via Alegria Ct
- 1558 Colt Way
- 1552 Colt Way
- 1564 Colt Way
- 1555 Via Alegria Ct
- 1546 Colt Way
- 1573 Via Alegria Ct
- 1549 Via Alegria Ct
- 1697 Ruther Place Ct
- 1570 Colt Way
- 1540 Colt Way
- 1691 Ruther Place Ct
- 3632 Ruther Place Way
- 1685 Ruther Place Ct
- 3618 Ruther Place Way
- 3644 Ruther Place Way
- 3606 Ruther Place Way
- 1559 Colt Way
- 1553 Colt Way
- 1565 Colt Way