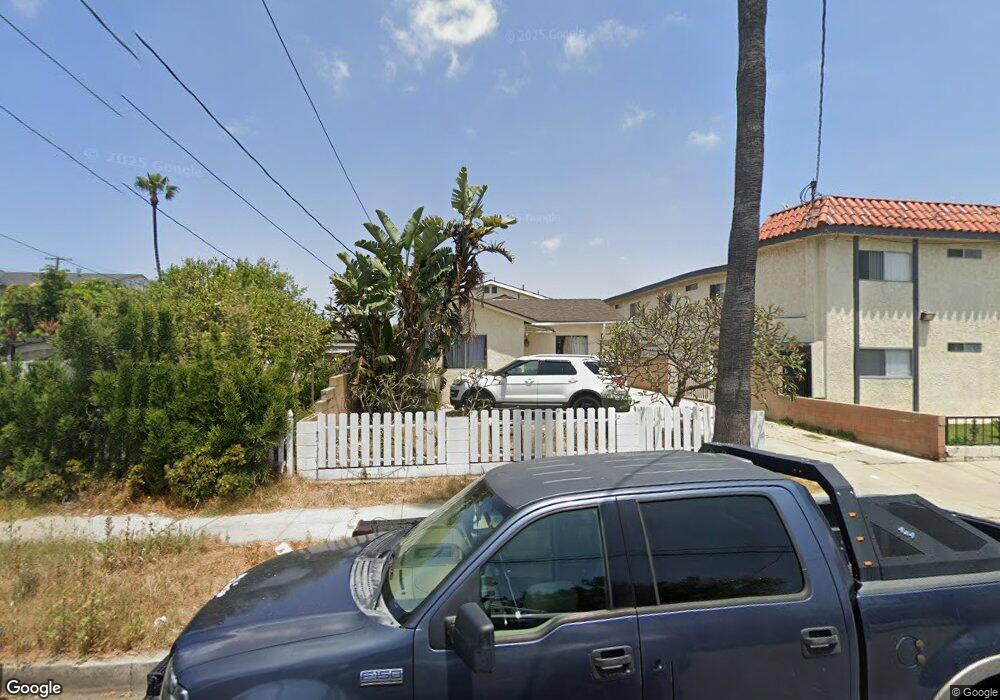
1561 W 224th St Unit B Torrance, CA 90501
Harbor Gateway NeighborhoodEstimated Value: $1,011,000 - $1,369,000
2
Beds
1
Bath
3,032
Sq Ft
$378/Sq Ft
Est. Value
About This Home
This home is located at 1561 W 224th St Unit B, Torrance, CA 90501 and is currently estimated at $1,147,157, approximately $378 per square foot. 1561 W 224th St Unit B is a home located in Los Angeles County with nearby schools including Meyler Street Elementary School, Alexander Fleming Middle School, and Nathaniel Narbonne Senior High School.
Ownership History
Date
Name
Owned For
Owner Type
Purchase Details
Closed on
Feb 15, 2025
Sold by
Lucy Investments Llc
Bought by
Vistar Ventures Llc
Current Estimated Value
Purchase Details
Closed on
Aug 5, 2021
Sold by
Dodson Mark R and Dodson Laaila
Bought by
Lucy Investments Llc
Purchase Details
Closed on
Jan 21, 2021
Sold by
Cheung Chun Chow and Cheung Poyin
Bought by
Dodson Mark E and Dodson Laaila
Home Financials for this Owner
Home Financials are based on the most recent Mortgage that was taken out on this home.
Original Mortgage
$696,750
Interest Rate
2.7%
Mortgage Type
New Conventional
Purchase Details
Closed on
Jan 8, 2015
Sold by
Sawiniuk Anna and Estate Of Zdzislaw Sawiniuk
Bought by
Cheung Chun Chow and Cheung Poyin
Create a Home Valuation Report for This Property
The Home Valuation Report is an in-depth analysis detailing your home's value as well as a comparison with similar homes in the area
Home Values in the Area
Average Home Value in this Area
Purchase History
| Date | Buyer | Sale Price | Title Company |
|---|---|---|---|
| Vistar Ventures Llc | -- | None Listed On Document | |
| Lucy Investments Llc | -- | None Listed On Document | |
| Dodson Mark E | $929,000 | Lawyers Title | |
| Cheung Chun Chow | $591,000 | Stewart Title |
Source: Public Records
Mortgage History
| Date | Status | Borrower | Loan Amount |
|---|---|---|---|
| Previous Owner | Dodson Mark E | $696,750 |
Source: Public Records
Tax History Compared to Growth
Tax History
| Year | Tax Paid | Tax Assessment Tax Assessment Total Assessment is a certain percentage of the fair market value that is determined by local assessors to be the total taxable value of land and additions on the property. | Land | Improvement |
|---|---|---|---|---|
| 2025 | $13,074 | $1,037,861 | $772,559 | $265,302 |
| 2024 | $13,074 | $1,017,511 | $757,411 | $260,100 |
| 2023 | $12,824 | $997,560 | $742,560 | $255,000 |
| 2022 | $11,889 | $947,580 | $561,000 | $386,580 |
| 2021 | $8,526 | $656,196 | $333,095 | $323,101 |
| 2020 | $8,604 | $649,468 | $329,680 | $319,788 |
| 2019 | $8,280 | $636,734 | $323,216 | $313,518 |
| 2018 | $8,122 | $624,250 | $316,879 | $307,371 |
| 2016 | $7,743 | $600,012 | $304,575 | $295,437 |
| 2015 | $4,072 | $300,585 | $72,384 | $228,201 |
| 2014 | $4,094 | $294,698 | $70,967 | $223,731 |
Source: Public Records
Map
Nearby Homes
- 1546 W 223rd St
- 1542 W 223rd St
- 1617 W 224th St
- 1503 W 224th St
- 22328 Denker Ave
- 1547 W 226th St
- 1524 W 222nd St
- 1570 W 226th St
- 1612 W 226th St
- 1414 W 224th St
- 1625 W 227th St
- 22720 Harvard Blvd
- 1616 W 227th St
- 1444 W 227th St Unit 7
- 1665 W 221st St
- 1636 W 219th St
- 22310 Spanish Oak Ct
- 22600 Normandie Ave Unit 3
- 2825 Martha Ave
- 1239 Bonnet Way
- 1561 W 224th St Unit A
- 1561 W 224th St
- 1563 W 224th St
- 22326 Harvard Blvd
- 1535 W 224th St
- 1549 W 224th St Unit 102
- 1549 W 224th St Unit 202
- 1549 W 224th St
- 1549 W 224th St Unit 206
- 1549 W 224th St Unit 104
- 1549 W 224th St Unit 105
- 1549 W 224th St Unit 106
- 1549 W 224th St Unit 101
- 1549 W 224th St Unit 204
- 1549 W 224th St Unit 203
- 22312 Harvard Blvd
- 1560 W 223rd St
- 1540 W 224th St
- 1556 W 223rd St
- 1552 W 223rd St