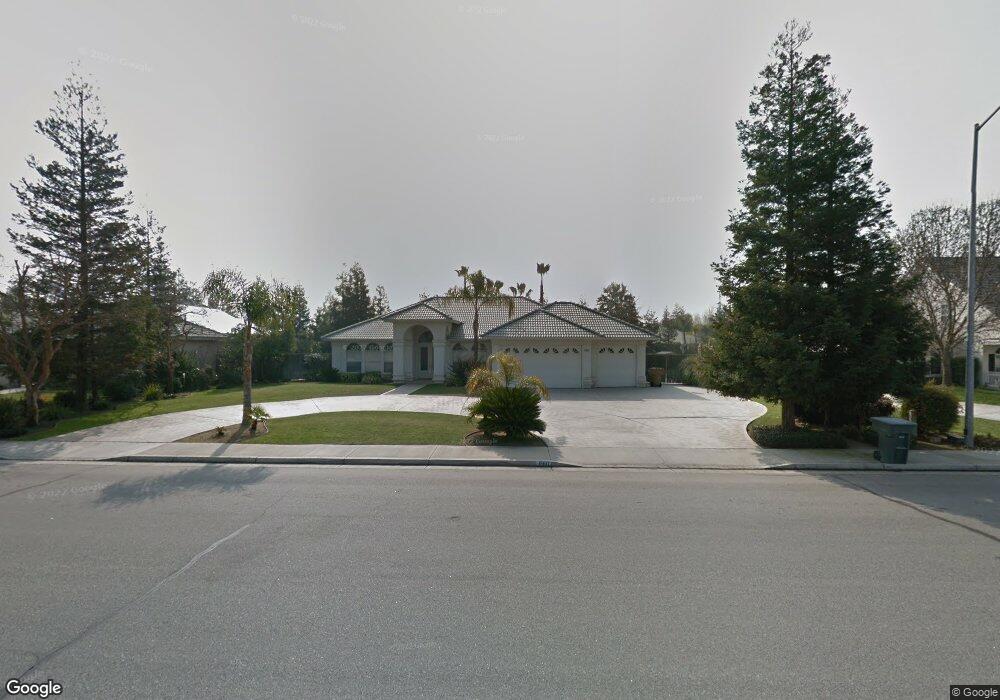
15611 Johnson Rd Bakersfield, CA 93314
Estimated Value: $698,946 - $851,000
4
Beds
2
Baths
2,748
Sq Ft
$275/Sq Ft
Est. Value
About This Home
This home is located at 15611 Johnson Rd, Bakersfield, CA 93314 and is currently estimated at $755,315, approximately $274 per square foot. 15611 Johnson Rd is a home located in Kern County with nearby schools including Rio Bravo-Greeley Elementary School, Rio Bravo Elementary School, and Liberty High School.
Ownership History
Date
Name
Owned For
Owner Type
Purchase Details
Closed on
Aug 7, 2014
Sold by
Cross Scott A and Cross Linda E
Bought by
The Cross Family Living Trust
Current Estimated Value
Purchase Details
Closed on
Oct 10, 2005
Sold by
Cross Scott A
Bought by
Cross Scott A and Cross Linda E
Purchase Details
Closed on
Dec 28, 1999
Sold by
Arriaga Luis E and Arriaga Regina G
Bought by
Smith David D and Smith Janet N
Home Financials for this Owner
Home Financials are based on the most recent Mortgage that was taken out on this home.
Original Mortgage
$228,756
Outstanding Balance
$68,749
Interest Rate
7.12%
Estimated Equity
$686,566
Purchase Details
Closed on
Mar 17, 1998
Sold by
Inland Homes
Bought by
Arriaga Luis E and Arriaga Regina G
Home Financials for this Owner
Home Financials are based on the most recent Mortgage that was taken out on this home.
Original Mortgage
$218,500
Interest Rate
6.86%
Mortgage Type
Construction
Create a Home Valuation Report for This Property
The Home Valuation Report is an in-depth analysis detailing your home's value as well as a comparison with similar homes in the area
Home Values in the Area
Average Home Value in this Area
Purchase History
| Date | Buyer | Sale Price | Title Company |
|---|---|---|---|
| The Cross Family Living Trust | -- | None Available | |
| Cross Scott A | -- | -- | |
| Smith David D | $286,000 | American Title Co | |
| Arriaga Luis E | $49,000 | Commonwealth Land Title Co |
Source: Public Records
Mortgage History
| Date | Status | Borrower | Loan Amount |
|---|---|---|---|
| Open | Smith David D | $228,756 | |
| Previous Owner | Arriaga Luis E | $218,500 |
Source: Public Records
Tax History Compared to Growth
Tax History
| Year | Tax Paid | Tax Assessment Tax Assessment Total Assessment is a certain percentage of the fair market value that is determined by local assessors to be the total taxable value of land and additions on the property. | Land | Improvement |
|---|---|---|---|---|
| 2025 | $6,534 | $448,957 | $101,370 | $347,587 |
| 2024 | $6,427 | $440,155 | $99,383 | $340,772 |
| 2023 | $6,427 | $431,526 | $97,435 | $334,091 |
| 2022 | $6,429 | $423,066 | $95,525 | $327,541 |
| 2021 | $6,344 | $414,771 | $93,652 | $321,119 |
| 2020 | $6,214 | $410,519 | $92,692 | $317,827 |
| 2019 | $6,140 | $410,519 | $92,692 | $317,827 |
| 2018 | $5,884 | $394,581 | $89,094 | $305,487 |
| 2017 | $5,827 | $386,846 | $87,348 | $299,498 |
| 2016 | $5,401 | $379,262 | $85,636 | $293,626 |
| 2015 | $5,267 | $373,566 | $84,350 | $289,216 |
| 2014 | $5,178 | $366,249 | $82,698 | $283,551 |
Source: Public Records
Map
Nearby Homes
- 15520 Arabella Ave
- 15710 Black Hawk Ave
- 15401 Mabel Ct
- 15400 Mabel Ct
- 311 Saba Way
- 16030 Strebor Dr
- 15112 Sunnybank Ave
- 214 Irish Crystal Ct
- 921 Christian Ave
- 15414 Donostia St
- 15209 Aldridge Ave
- 15628 Renteria Dr
- 15 Claudia Autumn Dr
- 14620 Sunnybank Ave
- 18 Claudia Autumn Dr
- 16459 Paraduxx Ct
- 309 Sonoma Vine Ct
- 14616 Tralee Dr
- 15701 Johnson Rd
- 15601 Johnson Rd
- 15521 Johnson Rd
- 15711 Johnson Rd
- 15610 Arabella Ave
- 15600 Arabella Ave
- 15700 Arabella Ave
- 400 Lucretia Ct
- 15710 Arabella Ave
- 15801 Johnson Rd
- 15511 Johnson Rd Unit B
- 15800 Arabella Ave Unit B
- 15510 Arabella Ave Unit B
- 410 Lucretia Ct
- 401 Lucretia Ct
- 15811 Johnson Rd
- 15501 Johnson Rd
- 15810 Arabella Ave
- 15500 Arabella Ave
- 15401 Manon Dr