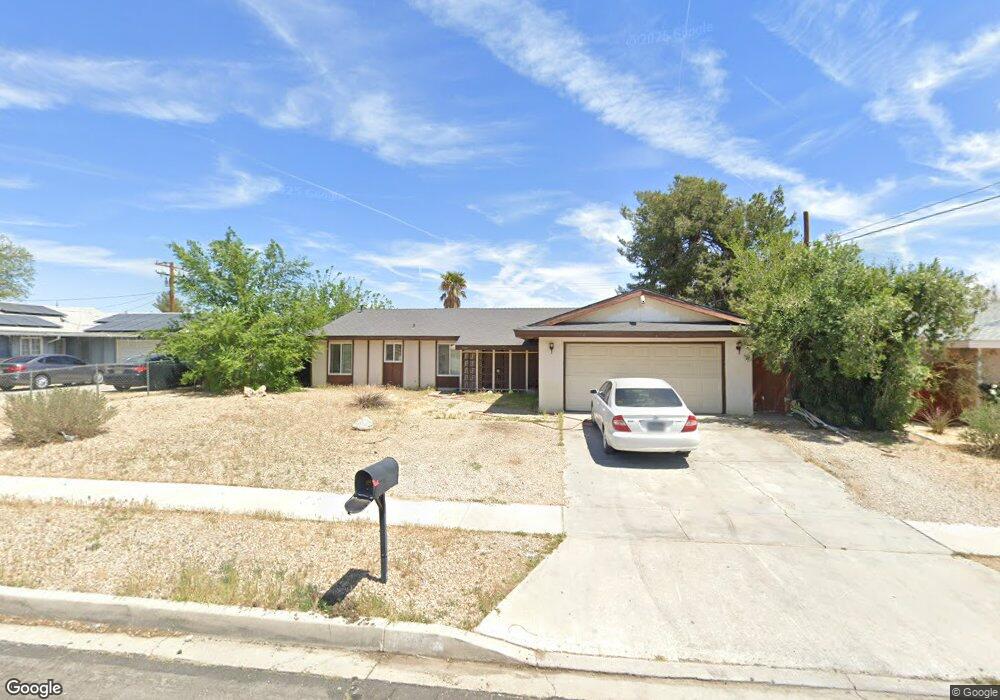
15611 La Verida Dr Victorville, CA 92395
Estimated Value: $318,000 - $348,397
4
Beds
2
Baths
1,153
Sq Ft
$293/Sq Ft
Est. Value
About This Home
This home is located at 15611 La Verida Dr, Victorville, CA 92395 and is currently estimated at $337,849, approximately $293 per square foot. 15611 La Verida Dr is a home located in San Bernardino County with nearby schools including Del Rey Elementary School, Green Tree East Elementary School, and Lakeview Leadership Academy.
Ownership History
Date
Name
Owned For
Owner Type
Purchase Details
Closed on
Aug 22, 2017
Sold by
Deluna Oscar R
Bought by
Deluna Oscar R and Deluna Maria D
Current Estimated Value
Purchase Details
Closed on
Jun 22, 2017
Sold by
Deluna Maria D
Bought by
Deluna Oscar R
Home Financials for this Owner
Home Financials are based on the most recent Mortgage that was taken out on this home.
Original Mortgage
$99,000
Outstanding Balance
$82,149
Interest Rate
4.02%
Mortgage Type
New Conventional
Estimated Equity
$255,700
Purchase Details
Closed on
May 23, 2017
Sold by
Watamaniuk Edward
Bought by
Deluna Oscar R
Home Financials for this Owner
Home Financials are based on the most recent Mortgage that was taken out on this home.
Original Mortgage
$99,000
Outstanding Balance
$82,149
Interest Rate
4.02%
Mortgage Type
New Conventional
Estimated Equity
$255,700
Create a Home Valuation Report for This Property
The Home Valuation Report is an in-depth analysis detailing your home's value as well as a comparison with similar homes in the area
Home Values in the Area
Average Home Value in this Area
Purchase History
| Date | Buyer | Sale Price | Title Company |
|---|---|---|---|
| Deluna Oscar R | -- | Accommodation | |
| Deluna Oscar R | -- | First American Title Company | |
| Deluna Oscar R | $152,000 | First American Title Company |
Source: Public Records
Mortgage History
| Date | Status | Borrower | Loan Amount |
|---|---|---|---|
| Open | Deluna Oscar R | $99,000 |
Source: Public Records
Tax History Compared to Growth
Tax History
| Year | Tax Paid | Tax Assessment Tax Assessment Total Assessment is a certain percentage of the fair market value that is determined by local assessors to be the total taxable value of land and additions on the property. | Land | Improvement |
|---|---|---|---|---|
| 2025 | $2,083 | $176,410 | $35,282 | $141,128 |
| 2024 | $2,083 | $172,951 | $34,590 | $138,361 |
| 2023 | $2,062 | $169,560 | $33,912 | $135,648 |
| 2022 | $3,452 | $166,235 | $33,247 | $132,988 |
| 2021 | $1,990 | $162,975 | $32,595 | $130,380 |
| 2020 | $1,955 | $161,304 | $32,261 | $129,043 |
| 2019 | $2,038 | $158,141 | $31,628 | $126,513 |
| 2018 | $2,048 | $155,040 | $31,008 | $124,032 |
| 2017 | $1,366 | $103,547 | $16,068 | $87,479 |
| 2016 | $1,339 | $101,517 | $15,753 | $85,764 |
| 2015 | $1,291 | $99,992 | $15,516 | $84,476 |
| 2014 | $1,150 | $88,600 | $17,300 | $71,300 |
Source: Public Records
Map
Nearby Homes
- 16301 Laguna St
- 15699 La Verida Dr
- 15700 Fresno Ct
- 16249 Encina St
- 16590 Forrest Ave
- 0 Green Hill Dr Unit OC24001536
- 0 Green Hill Dr Unit OC24001883
- 0 Green Hill Dr Unit OC24001920
- 15728 La Paz Dr
- 16593 Forrest Ave
- 16611 Yucca Ave
- 16134 Colina St
- 16297 Pepper Tree Dr
- 16690 Allen St
- 101 Pepper Tree Dr
- 16299 Pepper Tree Dr
- 16745 Forrest Ave
- 15277 Tatum Rd
- 15267 Del Rey Dr
- 16098 Tawney Ridge Ln
- 15621 La Verida Dr
- 15603 La Verida Dr
- 15616 Gazelle St
- 15628 Gazelle St
- 15587 La Verida Dr
- 15631 La Verida Dr
- 15610 La Verida Dr
- 15604 Gazelle St
- 15640 Gazelle St
- 16342 Forrest Ave
- 15643 La Verida Dr
- 16323 Tejon St
- 16324 Tejon St
- 15650 Gazelle St
- 16326 Forrest Ave
- 16363 Forrest Ave
- 16307 Tejon St
- 16377 Forrest Ave
- 15653 La Verida Dr
- 15627 Gazelle St