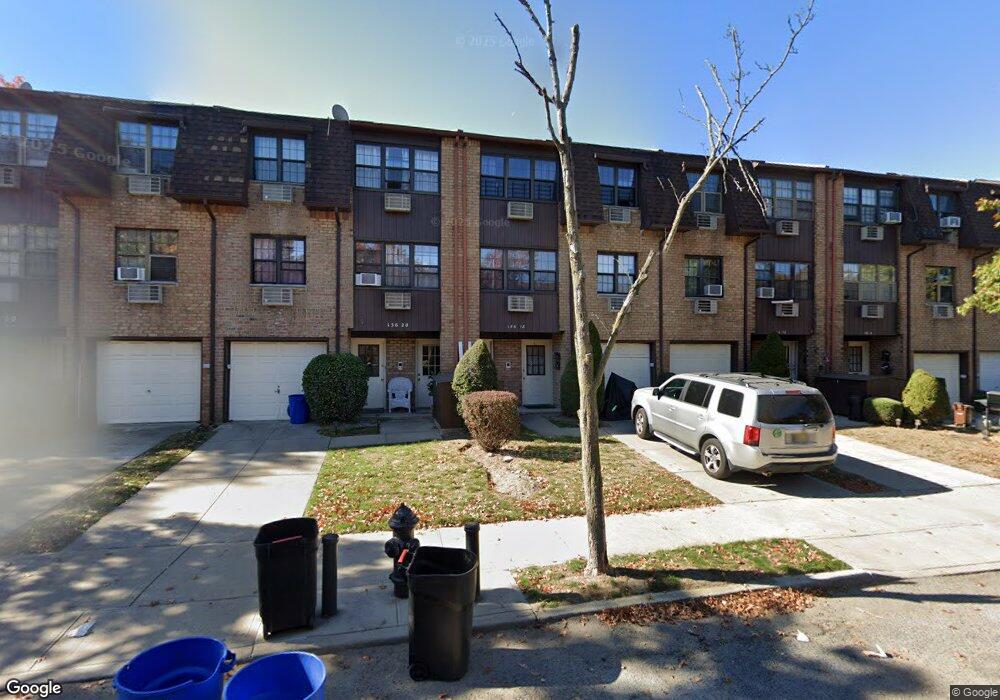
15618 78th St Unit 54 Howard Beach, NY 11414
Howard Beach NeighborhoodEstimated Value: $893,000 - $1,027,107
--
Bed
--
Bath
2,871
Sq Ft
$332/Sq Ft
Est. Value
About This Home
This home is located at 15618 78th St Unit 54, Howard Beach, NY 11414 and is currently estimated at $953,527, approximately $332 per square foot. 15618 78th St Unit 54 is a home located in Queens County with nearby schools including P.S. 232 - Lindenwood, Windy River Elementary School, and Robert H. Goddard High School.
Ownership History
Date
Name
Owned For
Owner Type
Purchase Details
Closed on
Mar 20, 2018
Sold by
Munoz Michelle and Munoz Roberto
Bought by
Viisintergrate Property Llc
Current Estimated Value
Home Financials for this Owner
Home Financials are based on the most recent Mortgage that was taken out on this home.
Original Mortgage
$345,000
Outstanding Balance
$295,637
Interest Rate
4.38%
Mortgage Type
New Conventional
Estimated Equity
$657,890
Purchase Details
Closed on
Sep 13, 2000
Sold by
Business & Brokerage Placement Assoc Ltd and Resicom Realty Management Corp
Bought by
Heresi Salvador H
Home Financials for this Owner
Home Financials are based on the most recent Mortgage that was taken out on this home.
Original Mortgage
$288,000
Interest Rate
8%
Mortgage Type
Purchase Money Mortgage
Purchase Details
Closed on
Dec 20, 1998
Sold by
Drum Kenneth
Bought by
Business & Brokerage Placement Associate
Create a Home Valuation Report for This Property
The Home Valuation Report is an in-depth analysis detailing your home's value as well as a comparison with similar homes in the area
Home Values in the Area
Average Home Value in this Area
Purchase History
| Date | Buyer | Sale Price | Title Company |
|---|---|---|---|
| Viisintergrate Property Llc | $575,000 | -- | |
| Heresi Salvador H | $320,000 | -- | |
| Business & Brokerage Placement Associate | $176,000 | -- |
Source: Public Records
Mortgage History
| Date | Status | Borrower | Loan Amount |
|---|---|---|---|
| Open | Viisintergrate Property Llc | $345,000 | |
| Previous Owner | Heresi Salvador H | $288,000 |
Source: Public Records
Tax History Compared to Growth
Tax History
| Year | Tax Paid | Tax Assessment Tax Assessment Total Assessment is a certain percentage of the fair market value that is determined by local assessors to be the total taxable value of land and additions on the property. | Land | Improvement |
|---|---|---|---|---|
| 2025 | $7,423 | $37,006 | $1,208 | $35,798 |
| 2024 | $7,423 | $36,960 | $1,444 | $35,516 |
| 2023 | $7,133 | $35,512 | $1,525 | $33,987 |
| 2022 | $6,688 | $42,438 | $1,954 | $40,484 |
| 2021 | $6,651 | $36,310 | $1,954 | $34,356 |
| 2020 | $6,527 | $38,783 | $1,954 | $36,829 |
| 2019 | $6,443 | $35,521 | $1,954 | $33,567 |
| 2018 | $6,033 | $29,593 | $1,593 | $28,000 |
| 2017 | $5,691 | $27,918 | $1,535 | $26,383 |
| 2016 | $5,265 | $27,918 | $1,535 | $26,383 |
| 2015 | $3,396 | $25,698 | $1,955 | $23,743 |
| 2014 | $3,396 | $25,667 | $1,954 | $23,713 |
Source: Public Records
Map
Nearby Homes
- 7717 156th Ave
- 156-17 78th St Unit 2
- 155- 3 79th St Unit 188
- 80-10 156th Ave Unit 223
- 156-33 80th St Unit 294
- 156-41 80th St Unit 4
- 8011 Shore Pkwy Unit 287
- 80-35 Shore Pkwy Unit 274
- 81-24 156th Ave Unit 240-CU
- 81-09 156th Ave Unit 5
- 153-32 79th St
- 156-14 76th St
- 81-12 155th Ave Unit 54
- 155-27 81st St Unit 30
- 80-65 Shore Pkwy Unit 254
- 81- 29 156th Ave Unit 4
- 157-31 80th St
- 81-49 156th Ave Unit 2R
- 82-26 155th Ave Unit 1
- 82-26 155th Ave Unit 2nd Level
- 15618 78th St Unit 1
- 156-18 78th St
- 15616 78th St Unit 53
- 15620 78th St Unit 55
- 156-20 78th St Unit 1Fl
- 15614 78th St Unit 52
- 15622 78th St Unit 56
- 15624 78th St Unit 57
- 15612 78th St Unit 51
- 15610 78th St Unit 50
- 156-14 78th St Unit 1
- 15608 78th St Unit 49
- 15606 78th St Unit 48
- 156-12 78th St Unit 1
- 15627 77th St Unit 82
- 15617 78th St Unit 40
- 15619 78th St Unit 39
- 15621 78th St Unit 38
- 15615 78th St Unit 41
- 156-6 78th St Unit 1