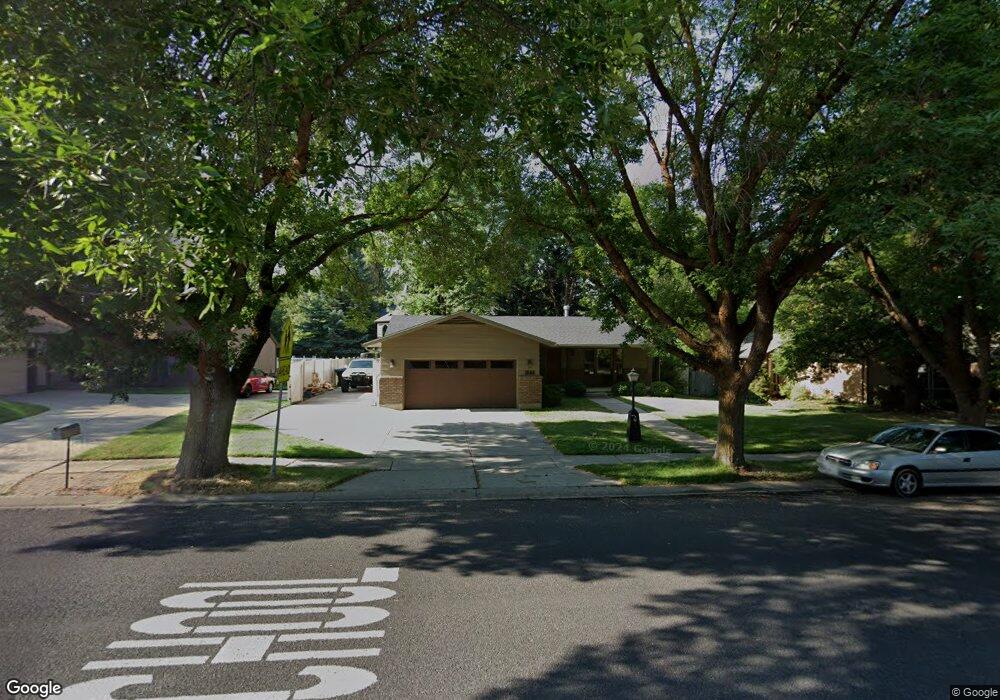
1562 E 1500 N Logan, UT 84341
Hillcrest NeighborhoodEstimated Value: $478,000 - $529,000
Studio
--
Bath
1,631
Sq Ft
$315/Sq Ft
Est. Value
About This Home
This home is located at 1562 E 1500 N, Logan, UT 84341 and is currently estimated at $513,406, approximately $314 per square foot. 1562 E 1500 N is a home with nearby schools including Hillcrest Elementary School, Mount Logan Middle School, and Logan High School.
Ownership History
Date
Name
Owned For
Owner Type
Purchase Details
Closed on
Apr 2, 2024
Sold by
Steven O Jensen O and Steven Shauna D
Bought by
Wengreen Tyler C and Wengreen Nakaila T
Current Estimated Value
Home Financials for this Owner
Home Financials are based on the most recent Mortgage that was taken out on this home.
Original Mortgage
$475,000
Outstanding Balance
$466,854
Interest Rate
6.77%
Mortgage Type
New Conventional
Estimated Equity
$46,552
Purchase Details
Closed on
May 25, 2023
Sold by
Jensen Steven
Bought by
Steven O Jensen And Shauna D Jensen Revocable
Home Financials for this Owner
Home Financials are based on the most recent Mortgage that was taken out on this home.
Original Mortgage
$24,999
Interest Rate
6.39%
Mortgage Type
Credit Line Revolving
Purchase Details
Closed on
Jul 19, 2006
Sold by
Jensen Steven O and Jensen Shauna D
Bought by
Jensen Steven O and Jensen Shauna D
Create a Home Valuation Report for This Property
The Home Valuation Report is an in-depth analysis detailing your home's value as well as a comparison with similar homes in the area
Home Values in the Area
Average Home Value in this Area
Purchase History
| Date | Buyer | Sale Price | Title Company |
|---|---|---|---|
| Wengreen Tyler C | -- | Hickman Land Title | |
| Wengreen Tyler C | -- | Hickman Land Title | |
| Steven O Jensen And Shauna D Jensen Revocable | -- | Hickman Land Title | |
| Jensen Steven | -- | Hickman Land Title | |
| Jensen Steven O | -- | Accommodation |
Source: Public Records
Mortgage History
| Date | Status | Borrower | Loan Amount |
|---|---|---|---|
| Open | Wengreen Tyler C | $475,000 | |
| Closed | Wengreen Tyler C | $475,000 | |
| Previous Owner | Jensen Steven | $24,999 |
Source: Public Records
Tax History
| Year | Tax Paid | Tax Assessment Tax Assessment Total Assessment is a certain percentage of the fair market value that is determined by local assessors to be the total taxable value of land and additions on the property. | Land | Improvement |
|---|---|---|---|---|
| 2025 | $2,156 | $278,850 | $0 | $0 |
| 2024 | $2,226 | $278,850 | $0 | $0 |
| 2023 | $2,323 | $277,420 | $0 | $0 |
| 2022 | $219 | $244,420 | $0 | $0 |
| 2021 | $2,078 | $358,000 | $70,000 | $288,000 |
| 2020 | $2,000 | $310,000 | $70,000 | $240,000 |
| 2019 | $1,811 | $268,636 | $70,000 | $198,636 |
| 2018 | $1,760 | $238,336 | $70,000 | $168,336 |
| 2017 | $1,539 | $110,165 | $0 | $0 |
| 2016 | $1,595 | $110,165 | $0 | $0 |
| 2015 | $1,597 | $110,165 | $0 | $0 |
| 2014 | $1,435 | $109,480 | $0 | $0 |
| 2013 | -- | $109,480 | $0 | $0 |
Source: Public Records
Map
Nearby Homes
- 1450 N 1525 E
- 1535 E 1385 N
- 1440 N 1600 E
- 1454 N 1400 E
- 1336 E Talmage Ln Unit 38
- 1512 E 1260 N
- 1374 N 1250 E Unit 48
- 1354 N 1250 E Unit 46
- 1341 N 1250 E Unit 41
- 1357 E 1220 N
- 1782 E 1250 N
- 1133 N 1520 E
- 1586 N Sharptail Cir
- 1405 N Aspen Dr
- 1902 E 1500 N
- 1451 N Aspen Dr
- 1475 N Aspen Dr Unit 16
- 1720 N 1850 E
- 1901 Southpointe Ct
- 1949 Deer Crest Cir Unit 49
Your Personal Tour Guide
Ask me questions while you tour the home.