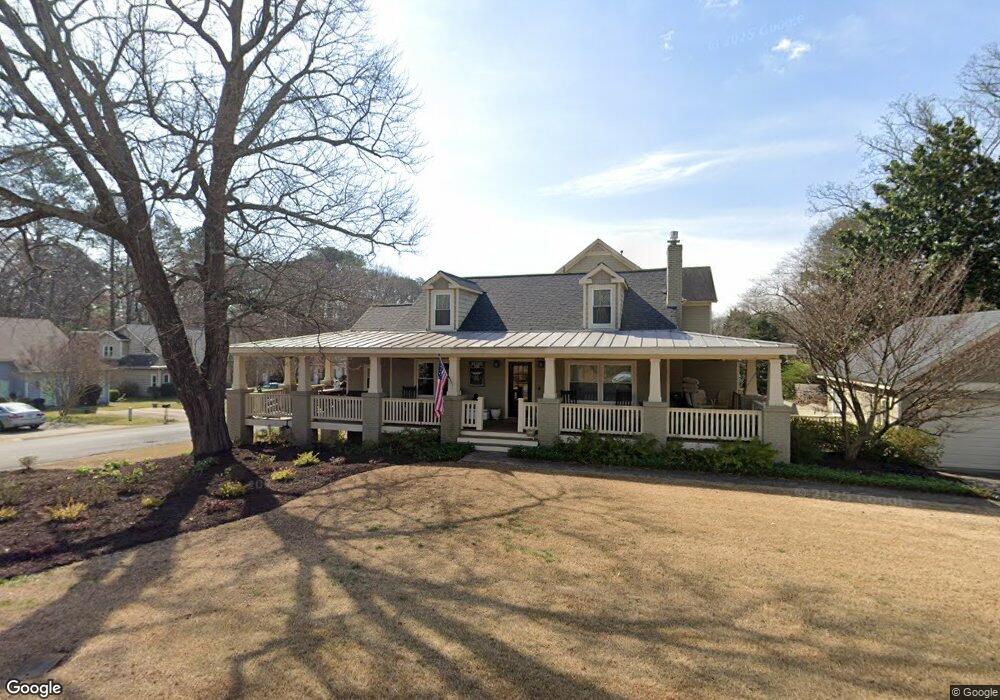
1562 Whitfield St SE Smyrna, GA 30080
Estimated Value: $458,000 - $647,000
3
Beds
3
Baths
1,808
Sq Ft
$300/Sq Ft
Est. Value
About This Home
This home is located at 1562 Whitfield St SE, Smyrna, GA 30080 and is currently estimated at $542,708, approximately $300 per square foot. 1562 Whitfield St SE is a home located in Cobb County with nearby schools including Smyrna Elementary School, Campbell Middle School, and Campbell High School.
Ownership History
Date
Name
Owned For
Owner Type
Purchase Details
Closed on
Apr 16, 2007
Sold by
Cjs Const Inc
Bought by
Mcelveen Jaems L and Mcelveen Linda H
Current Estimated Value
Home Financials for this Owner
Home Financials are based on the most recent Mortgage that was taken out on this home.
Original Mortgage
$295,200
Interest Rate
6.1%
Mortgage Type
New Conventional
Purchase Details
Closed on
Mar 27, 2006
Sold by
Floccari Jeremiah and Floccari Shellie M
Bought by
Bel Oak Capital Llc
Purchase Details
Closed on
May 31, 2001
Sold by
Reece Emmett M
Bought by
Floccari Jeremiah and Floccari Shellie M
Home Financials for this Owner
Home Financials are based on the most recent Mortgage that was taken out on this home.
Original Mortgage
$100,400
Interest Rate
7.18%
Mortgage Type
New Conventional
Create a Home Valuation Report for This Property
The Home Valuation Report is an in-depth analysis detailing your home's value as well as a comparison with similar homes in the area
Home Values in the Area
Average Home Value in this Area
Purchase History
| Date | Buyer | Sale Price | Title Company |
|---|---|---|---|
| Mcelveen Jaems L | $369,000 | -- | |
| Bel Oak Capital Llc | $235,000 | -- | |
| Floccari Jeremiah | $125,500 | -- |
Source: Public Records
Mortgage History
| Date | Status | Borrower | Loan Amount |
|---|---|---|---|
| Previous Owner | Mcelveen Jaems L | $295,200 | |
| Previous Owner | Floccari Jeremiah | $100,400 |
Source: Public Records
Tax History Compared to Growth
Tax History
| Year | Tax Paid | Tax Assessment Tax Assessment Total Assessment is a certain percentage of the fair market value that is determined by local assessors to be the total taxable value of land and additions on the property. | Land | Improvement |
|---|---|---|---|---|
| 2025 | $1,172 | $226,448 | $72,848 | $153,600 |
| 2024 | $1,172 | $226,448 | $72,848 | $153,600 |
| 2023 | $1,020 | $183,336 | $68,200 | $115,136 |
| 2022 | $1,172 | $167,684 | $68,200 | $99,484 |
| 2021 | $1,192 | $153,184 | $66,648 | $86,536 |
| 2020 | $1,138 | $142,336 | $55,800 | $86,536 |
| 2019 | $3,511 | $137,684 | $51,148 | $86,536 |
| 2018 | $3,253 | $128,288 | $48,048 | $80,240 |
| 2017 | $2,852 | $120,540 | $40,300 | $80,240 |
| 2016 | $2,693 | $114,340 | $34,100 | $80,240 |
| 2015 | $2,651 | $110,260 | $30,020 | $80,240 |
| 2014 | $2,869 | $117,484 | $0 | $0 |
Source: Public Records
Map
Nearby Homes
- 1764 Whitfield Parc Cir
- 1761 Whitfield Parc Cir SE
- 1579 Walker St SE
- 2781 Mathews St SE
- 1417 Springleaf Cir SE
- 1461 Hawthorne Ave SE
- 1768 Evenstad Way
- 3037 Ferrington Way
- 1537 Springleaf Cove SE
- 1700 Wynndowne Trail SE Unit C
- 3001 Hawthorne Place SE
- 2964 Anderson Cir SE
- 2861 Bernard Ln SE
- 1722 Wynndowne Trail SE
- 1385 Hawthorne Ave SE
- 2908 Cottesford Way SE
- 2654 Davenport St SE
- 1010 Whitfield Ct SE
- 1550 Whitfield St SE
- 1020 Whitfield Ct SE
- 1557 Whitfield St SE
- 1561 Whitfield St SE
- 1553 Whitfield St SE
- 1001 Whitfield Ct SE
- 1003 Whitfield Ct SE
- 1026 Whitfield Ct SE
- 1565 Whitfield St SE
- 1013 Whitfield Ct SE
- 1569 Whitfield St
- 1540 Whitfield St
- 1015 Whitfield Ct SE
- 1701 Whitfield Parc Cir SE
- 1536 Whitfield
- 1030 Whitfield Ct SE
- 2689 Windy Hill Place SE
- 1700 Whitfield Parc Cir
- 1705 Whitfield Parc Cir SE