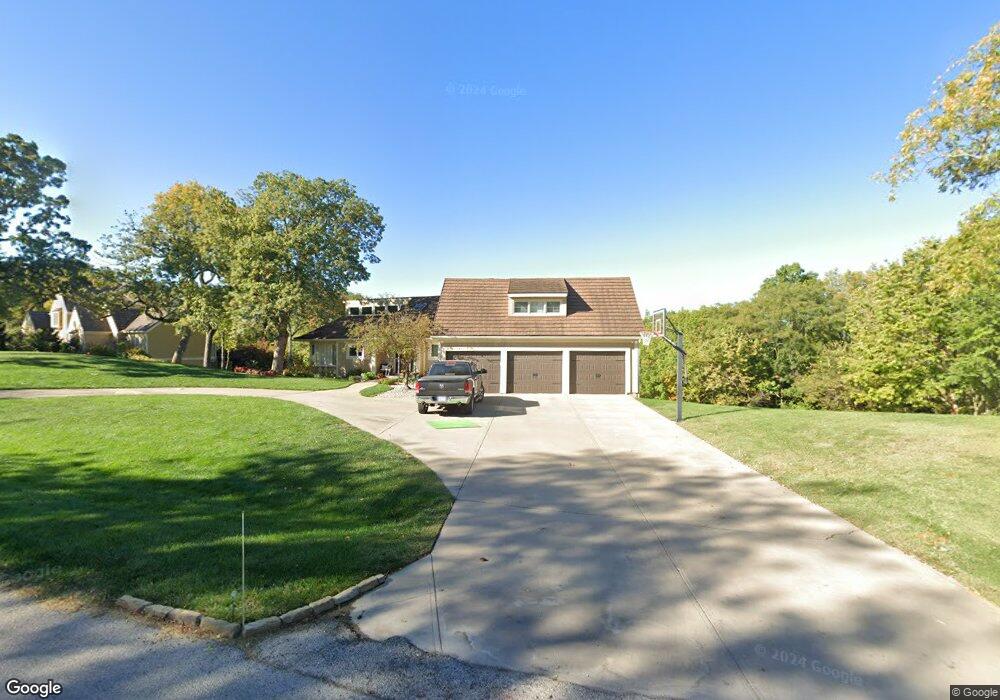
15622 Overbrook Ln Overland Park, KS 66224
Estimated Value: $739,000 - $957,102
5
Beds
5
Baths
3,187
Sq Ft
$253/Sq Ft
Est. Value
About This Home
This home is located at 15622 Overbrook Ln, Overland Park, KS 66224 and is currently estimated at $805,276, approximately $252 per square foot. 15622 Overbrook Ln is a home located in Johnson County with nearby schools including Blue River Elementary School, Blue Valley Middle School, and Blue Valley High School.
Ownership History
Date
Name
Owned For
Owner Type
Purchase Details
Closed on
Nov 8, 2006
Sold by
White Kurt A and White Cynthia G
Bought by
Linderman Aaron T and Linderman Sarah F
Current Estimated Value
Home Financials for this Owner
Home Financials are based on the most recent Mortgage that was taken out on this home.
Original Mortgage
$385,200
Outstanding Balance
$229,893
Interest Rate
6.37%
Mortgage Type
New Conventional
Estimated Equity
$575,383
Purchase Details
Closed on
Dec 5, 2003
Sold by
Campbell Cynthia P and Campbell J
Bought by
White Kurt A and White Cynthia G
Purchase Details
Closed on
Jan 18, 2002
Sold by
Campbell Cynthia P and Campbell J
Bought by
Campbell Cynthia P and Campbell J
Home Financials for this Owner
Home Financials are based on the most recent Mortgage that was taken out on this home.
Original Mortgage
$259,150
Interest Rate
6.53%
Create a Home Valuation Report for This Property
The Home Valuation Report is an in-depth analysis detailing your home's value as well as a comparison with similar homes in the area
Home Values in the Area
Average Home Value in this Area
Purchase History
| Date | Buyer | Sale Price | Title Company |
|---|---|---|---|
| Linderman Aaron T | -- | None Available | |
| White Kurt A | -- | Security Land Title Company | |
| Campbell Cynthia P | -- | All American Title Company | |
| Campbell J D | -- | All American Title Company |
Source: Public Records
Mortgage History
| Date | Status | Borrower | Loan Amount |
|---|---|---|---|
| Open | Linderman Aaron T | $385,200 | |
| Previous Owner | Campbell J D | $259,150 |
Source: Public Records
Tax History Compared to Growth
Tax History
| Year | Tax Paid | Tax Assessment Tax Assessment Total Assessment is a certain percentage of the fair market value that is determined by local assessors to be the total taxable value of land and additions on the property. | Land | Improvement |
|---|---|---|---|---|
| 2024 | $7,920 | $76,728 | $14,723 | $62,005 |
| 2023 | $8,095 | $77,131 | $12,831 | $64,300 |
| 2022 | $7,709 | $71,795 | $12,831 | $58,964 |
| 2021 | $7,564 | $66,550 | $11,662 | $54,888 |
| 2020 | $7,531 | $64,975 | $13,740 | $51,235 |
| 2019 | $7,467 | $62,813 | $12,911 | $49,902 |
| 2018 | $6,945 | $58,891 | $12,911 | $45,980 |
| 2017 | $7,205 | $58,270 | $11,227 | $47,043 |
| 2016 | $6,721 | $54,291 | $11,227 | $43,064 |
| 2015 | $6,755 | $53,866 | $11,227 | $42,639 |
| 2013 | -- | $48,265 | $11,227 | $37,038 |
Source: Public Records
Map
Nearby Homes
- 16201 Spyglass Ct
- 16313 Turnberry
- 114 Wolsey Bridge Pkwy
- 15704 Chadwick St
- 15801 Canterbury St
- 16140 Canterbury Rd
- 3301 W 157th St
- 2628 W 162nd Terrace
- 18465 Windsor St
- 18464 Windsor St
- 18605 Reinhardt St
- 18612 Reinhardt St
- 18452 Pawnee Ln
- 18456 Pawnee Ln
- 18460 Pawnee Ln
- 18505 Pawnee Ln
- 18509 Pawnee Ln
- 16505 MacAllister Ct
- 107 E 165th St
- 3500 W 153rd St
- 15704 Overbrook Ln
- 15625 Overbrook Ln
- 15613 Overbrook Ln
- 15705 Overbrook Ln
- 15612 Overbrook Ln
- 15608 Overbrook Ln
- 15712 Overbrook Ln
- 15609 Overbrook Ln
- 15717 Overbrook Ln
- 15800 Meadow Ln
- 15604 Overbrook Ln
- 15810 Meadow Ln
- 16002 Spyglass Ct
- 15601 Overbrook Ln
- 16004 Spyglass Ct
- 15723 Overbrook Ln
- 15814 Meadow Ln
- 15520 Overbrook Ln
- 15801 Meadow Ln
- 15811 Meadow Ln