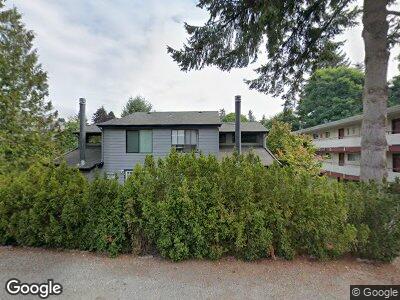
15626 8th Ave SW Unit 37 Burien, WA 98166
Downtown Burien NeighborhoodEstimated Value: $439,000 - $541,640
2
Beds
2
Baths
1,621
Sq Ft
$309/Sq Ft
Est. Value
About This Home
This home is located at 15626 8th Ave SW Unit 37, Burien, WA 98166 and is currently estimated at $500,160, approximately $308 per square foot. 15626 8th Ave SW Unit 37 is a home located in King County with nearby schools including Gregory Heights Elementary School, Sylvester Middle School, and Highline High School.
Ownership History
Date
Name
Owned For
Owner Type
Purchase Details
Closed on
Aug 26, 2019
Sold by
Goodman Gari
Bought by
Yang Kuanghui and Yang Shirleen Shuchen
Current Estimated Value
Home Financials for this Owner
Home Financials are based on the most recent Mortgage that was taken out on this home.
Original Mortgage
$195,000
Outstanding Balance
$175,651
Interest Rate
3.87%
Mortgage Type
Adjustable Rate Mortgage/ARM
Purchase Details
Closed on
Mar 14, 2013
Sold by
Brown Mary C
Bought by
Goodman Gari
Home Financials for this Owner
Home Financials are based on the most recent Mortgage that was taken out on this home.
Original Mortgage
$119,000
Interest Rate
3.49%
Purchase Details
Closed on
Jun 18, 1998
Sold by
Melhouse Selmer A and Melhouse Aase R
Bought by
Brown Mary C
Home Financials for this Owner
Home Financials are based on the most recent Mortgage that was taken out on this home.
Original Mortgage
$100,000
Interest Rate
7.17%
Create a Home Valuation Report for This Property
The Home Valuation Report is an in-depth analysis detailing your home's value as well as a comparison with similar homes in the area
Home Values in the Area
Average Home Value in this Area
Purchase History
| Date | Buyer | Sale Price | Title Company |
|---|---|---|---|
| Yang Kuanghui | $305,000 | Ticor Title | |
| Goodman Gari | $190,000 | Stewart Title | |
| Brown Mary C | $130,000 | Chicago Title Insurance Co |
Source: Public Records
Mortgage History
| Date | Status | Borrower | Loan Amount |
|---|---|---|---|
| Open | Yang Kuanghui | $195,000 | |
| Previous Owner | Goodman Gari | $119,000 | |
| Previous Owner | Brown Mary C | $123,000 | |
| Previous Owner | Brown Mary C | $100,000 |
Source: Public Records
Tax History Compared to Growth
Tax History
| Year | Tax Paid | Tax Assessment Tax Assessment Total Assessment is a certain percentage of the fair market value that is determined by local assessors to be the total taxable value of land and additions on the property. | Land | Improvement |
|---|---|---|---|---|
| 2024 | $5,419 | $483,000 | $51,000 | $432,000 |
| 2023 | $5,703 | $489,000 | $50,300 | $438,700 |
| 2022 | $4,050 | $369,000 | $48,900 | $320,100 |
| 2021 | $3,746 | $323,000 | $46,000 | $277,000 |
| 2020 | $3,629 | $288,000 | $43,100 | $244,900 |
| 2018 | $3,456 | $268,000 | $34,500 | $233,500 |
| 2017 | $3,113 | $242,000 | $34,500 | $207,500 |
| 2016 | $2,960 | $220,000 | $34,500 | $185,500 |
| 2015 | $3,104 | $214,000 | $43,100 | $170,900 |
| 2014 | -- | $218,000 | $43,100 | $174,900 |
| 2013 | -- | $201,000 | $43,100 | $157,900 |
Source: Public Records
Map
Nearby Homes
- 15612 8th Ave SW Unit 104
- 15610 8th Ave SW Unit 103
- 15525 6th Ave SW Unit 3
- 430 SW 156th St Unit 204
- 430 SW 156th St Unit 202
- 15455 10th Ave SW
- 15825 10th Ave SW
- 15910 3rd Place SW Unit B
- 1014 SW 154th St
- 15314 4th Ave SW Unit 3
- 15100 6th Ave SW Unit 528
- 15100 6th Ave SW Unit 513
- 15100 6th Ave SW Unit 728
- 15100 6th Ave SW Unit 730
- 15100 6th Ave SW Unit 420
- 15100 6th Ave SW Unit 311
- 1229 SW 158th St
- 16054 3rd Ave SW
- 16244 9th Ave SW
- 16241 9th Ave SW
- 15626 8th Ave SW Unit A
- 15626 8th Ave SW Unit 1
- 15626 8th Ave SW Unit 516
- 15626 8th Ave SW Unit 310
- 15626 8th Ave SW Unit 617
- 15626 8th Ave SW Unit 38
- 15626 8th Ave SW Unit 2
- 15626 8th Ave SW Unit 620
- 15626 8th Ave SW Unit 619
- 15626 8th Ave SW Unit 618
- 15626 8th Ave SW Unit 39
- 15626 8th Ave SW Unit 515
- 15626 8th Ave SW Unit 414
- 15626 8th Ave SW Unit 413
- 15626 8th Ave SW Unit 412
- 15626 8th Ave SW Unit 411
- 15626 8th Ave SW Unit 37
- 15626 8th Ave SW Unit 26
- 15626 8th Ave SW Unit 25
- 15626 8th Ave SW Unit 24