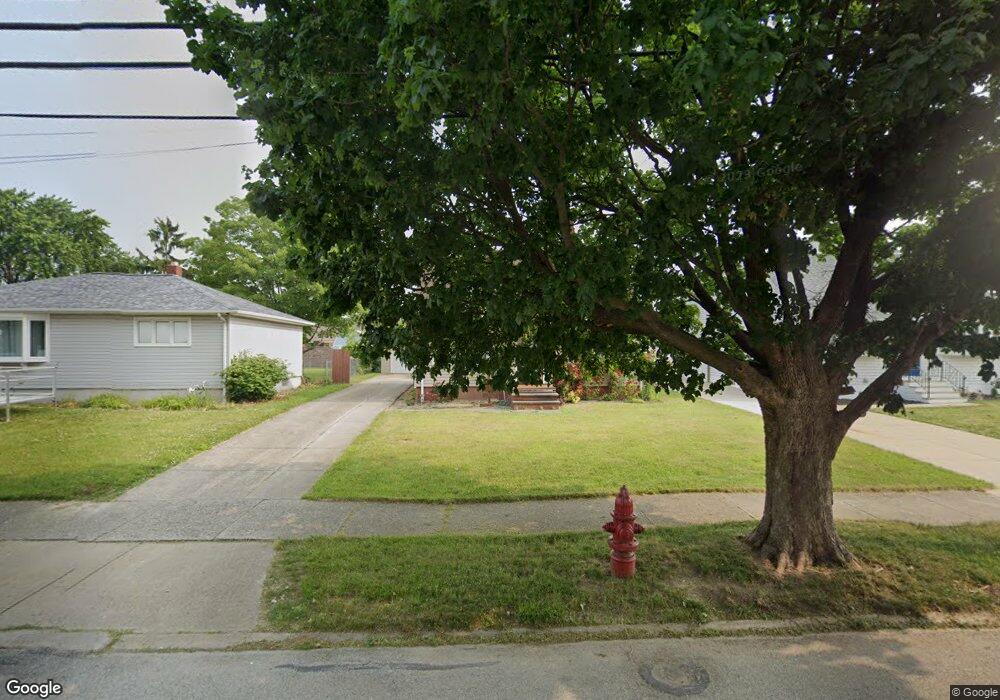
15628 Rademaker Dr Brookpark, OH 44142
Estimated Value: $191,750 - $240,000
3
Beds
2
Baths
1,131
Sq Ft
$191/Sq Ft
Est. Value
About This Home
This home is located at 15628 Rademaker Dr, Brookpark, OH 44142 and is currently estimated at $216,438, approximately $191 per square foot. 15628 Rademaker Dr is a home located in Cuyahoga County with nearby schools including Berea-Midpark Middle School, Berea-Midpark High School, and Huber Heights Preparatory Academy Parma Academy.
Ownership History
Date
Name
Owned For
Owner Type
Purchase Details
Closed on
Aug 22, 2000
Sold by
Stanascek Raymond H
Bought by
Hopp Fred
Current Estimated Value
Home Financials for this Owner
Home Financials are based on the most recent Mortgage that was taken out on this home.
Original Mortgage
$77,000
Outstanding Balance
$27,998
Interest Rate
8.26%
Estimated Equity
$188,440
Purchase Details
Closed on
Jul 14, 1999
Sold by
Dennis Sharron K
Bought by
Stanaszek Raymond H
Purchase Details
Closed on
Oct 16, 1997
Sold by
Frank Dennis
Bought by
Dennis Sharron K
Purchase Details
Closed on
Feb 6, 1991
Sold by
Shaheen Paul G
Bought by
Dennis Frank
Purchase Details
Closed on
Feb 10, 1983
Sold by
Vassily Stephen R and Vassily Jean D
Bought by
Shaheen Paul G
Purchase Details
Closed on
Feb 20, 1979
Sold by
Vassily Stephen R and Vassily Jean D
Bought by
Vassily Stephen R and Vassily Jean D
Purchase Details
Closed on
Jan 1, 1975
Bought by
Vassily Stephen R and Vassily Jean D
Create a Home Valuation Report for This Property
The Home Valuation Report is an in-depth analysis detailing your home's value as well as a comparison with similar homes in the area
Home Values in the Area
Average Home Value in this Area
Purchase History
| Date | Buyer | Sale Price | Title Company |
|---|---|---|---|
| Hopp Fred | $107,000 | -- | |
| Stanaszek Raymond H | $99,000 | Quality Title Agency Inc | |
| Dennis Sharron K | -- | -- | |
| Dennis Frank | $75,000 | -- | |
| Shaheen Paul G | $49,000 | -- | |
| Vassily Stephen R | -- | -- | |
| Vassily Stephen R | -- | -- |
Source: Public Records
Mortgage History
| Date | Status | Borrower | Loan Amount |
|---|---|---|---|
| Open | Hopp Fred | $77,000 |
Source: Public Records
Tax History
| Year | Tax Paid | Tax Assessment Tax Assessment Total Assessment is a certain percentage of the fair market value that is determined by local assessors to be the total taxable value of land and additions on the property. | Land | Improvement |
|---|---|---|---|---|
| 2024 | $2,918 | $57,855 | $12,180 | $45,675 |
| 2023 | $2,763 | $45,370 | $8,860 | $36,510 |
| 2022 | $2,744 | $45,360 | $8,855 | $36,505 |
| 2021 | $2,728 | $45,360 | $8,860 | $36,510 |
| 2020 | $2,461 | $36,020 | $7,040 | $28,980 |
| 2019 | $2,387 | $102,900 | $20,100 | $82,800 |
| 2018 | $2,265 | $36,020 | $7,040 | $28,980 |
| 2017 | $2,331 | $32,620 | $6,930 | $25,690 |
| 2016 | $2,312 | $32,620 | $6,930 | $25,690 |
| 2015 | $2,284 | $32,620 | $6,930 | $25,690 |
| 2014 | $2,284 | $34,340 | $7,280 | $27,060 |
Source: Public Records
Map
Nearby Homes
- 15532 Rademaker Dr
- 16159 Bowfin Blvd
- 16117 Hocking Blvd
- 15497 Hummel Rd
- 16001 Sylvia Dr
- 16379 Hummel Rd
- 15633 Harrison Dr
- 6131 Hardin Dr
- 15424 Holland Rd
- 5727 Gateway Ln Unit 1203
- 6095 Stark Dr
- 6330 Ledgebrook Dr
- 6040 Slater Dr
- 6103 Westbrook Dr
- 6014 Westbrook Dr
- 6377 Ledgebrook Dr
- 6016 Gilmere Dr
- 5757 Defiance Ave
- 5889 Westbrook Dr
- 14024 Donald Dr
- 15604 Rademaker Dr
- 15654 Rademaker Dr
- 15678 Rademaker Dr
- 15580 Rademaker Dr
- 15704 Rademaker Dr
- 15556 Rademaker Dr
- 15651 Rademaker Dr
- 15619 Rademaker Dr
- 15728 Rademaker Dr
- 15687 Rademaker Dr
- 15591 Rademaker Dr
- 15567 Rademaker Dr
- 15752 Rademaker Dr
- 15508 Rademaker Dr
- 15725 Rademaker Dr
- 15543 Rademaker Dr
- 15503 Darke Blvd
- 15484 Rademaker Dr
- 15776 Rademaker Dr
- 15684 Fayette Blvd
Your Personal Tour Guide
Ask me questions while you tour the home.