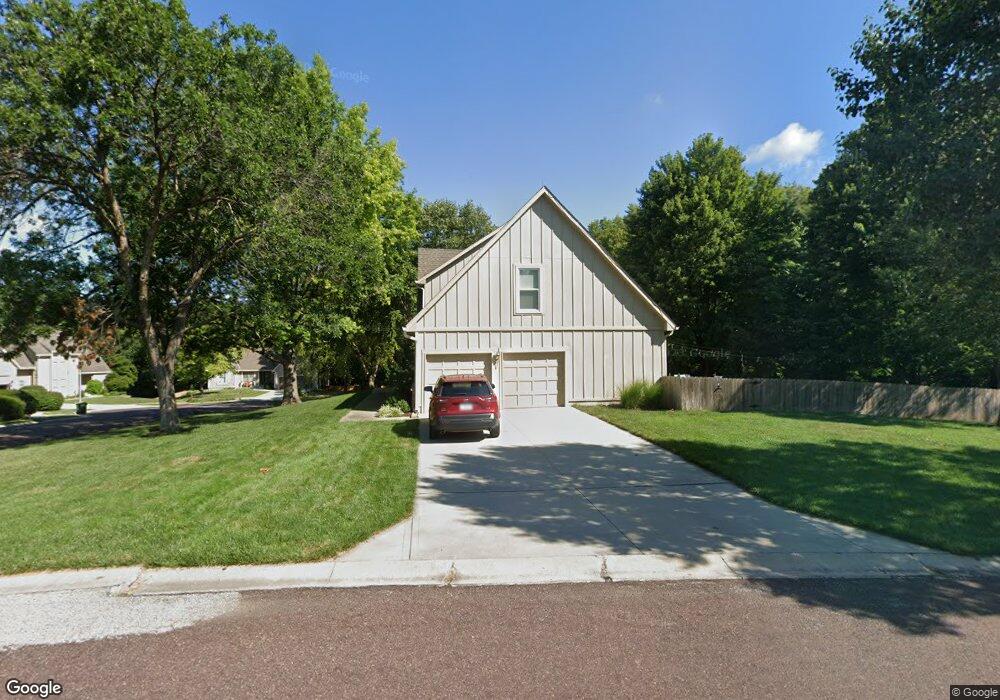
15629 Dearborn St Overland Park, KS 66223
Blue Valley NeighborhoodEstimated Value: $477,000 - $507,399
4
Beds
4
Baths
2,441
Sq Ft
$203/Sq Ft
Est. Value
About This Home
This home is located at 15629 Dearborn St, Overland Park, KS 66223 and is currently estimated at $495,100, approximately $202 per square foot. 15629 Dearborn St is a home located in Johnson County with nearby schools including Stanley Elementary School, Blue Valley Middle School, and Blue Valley High School.
Ownership History
Date
Name
Owned For
Owner Type
Purchase Details
Closed on
Oct 25, 2016
Sold by
Unruh Kristen M and Beckner Kristen M
Bought by
Unruh Joseph D
Current Estimated Value
Purchase Details
Closed on
Feb 27, 2007
Sold by
Kay James E
Bought by
Unruh Joseph D
Home Financials for this Owner
Home Financials are based on the most recent Mortgage that was taken out on this home.
Original Mortgage
$220,500
Interest Rate
6.21%
Mortgage Type
New Conventional
Purchase Details
Closed on
Nov 20, 2003
Sold by
Kay James E
Bought by
Kay James E and James E Kay Revocable Trust
Purchase Details
Closed on
Aug 7, 2003
Sold by
Kay Jami L
Bought by
Kay James E
Purchase Details
Closed on
Mar 11, 2003
Sold by
Kay Jami
Bought by
Kay James E
Create a Home Valuation Report for This Property
The Home Valuation Report is an in-depth analysis detailing your home's value as well as a comparison with similar homes in the area
Home Values in the Area
Average Home Value in this Area
Purchase History
| Date | Buyer | Sale Price | Title Company |
|---|---|---|---|
| Unruh Joseph D | -- | None Available | |
| Unruh Joseph D | -- | First American Title Ins Co | |
| Kay James E | -- | -- | |
| Kay James E | -- | -- | |
| Kay James E | -- | -- |
Source: Public Records
Mortgage History
| Date | Status | Borrower | Loan Amount |
|---|---|---|---|
| Previous Owner | Unruh Joseph D | $220,500 |
Source: Public Records
Tax History Compared to Growth
Tax History
| Year | Tax Paid | Tax Assessment Tax Assessment Total Assessment is a certain percentage of the fair market value that is determined by local assessors to be the total taxable value of land and additions on the property. | Land | Improvement |
|---|---|---|---|---|
| 2024 | $5,067 | $49,634 | $11,614 | $38,020 |
| 2023 | $4,982 | $47,898 | $11,614 | $36,284 |
| 2022 | $4,635 | $43,781 | $11,614 | $32,167 |
| 2021 | $4,274 | $38,272 | $10,098 | $28,174 |
| 2020 | $4,237 | $37,685 | $8,075 | $29,610 |
| 2019 | $4,038 | $35,167 | $5,381 | $29,786 |
| 2018 | $4,030 | $34,397 | $5,381 | $29,016 |
| 2017 | $3,838 | $32,189 | $5,381 | $26,808 |
| 2016 | $3,658 | $30,659 | $5,381 | $25,278 |
| 2015 | $3,487 | $29,118 | $5,381 | $23,737 |
| 2013 | -- | $26,818 | $5,381 | $21,437 |
Source: Public Records
Map
Nearby Homes
- 15316 Woodson Ln
- 6115 W 157th St
- 5901 W 153rd Terrace
- 6214 W 156th Terrace
- 5501 W 155th St
- 15821 Rosewood St
- 15612 Barkley St
- 15134 Beverly St
- 5105 W 157th St
- 6301 W 158th Place
- 15457 Iron Horse Cir
- 15856 Glenwood Ave
- 15603 Linden Ln
- 15090 Walmer St
- 16009 Ash St
- 3900 W 158th Place
- 4005 W 158th Place
- 3953 W 158th Place
- 15813 Linden St
- 15416 Floyd St
- 15633 Dearborn St
- 15625 Dearborn St
- 5902 W 157th St
- 15622 Dearborn St
- 5816 W 157th St
- 15634 Dearborn St
- 5909 W 157th St
- 15626 Dearborn St
- 5812 W 157th St
- 15701 Dearborn St
- 5811 W 157th St
- 5808 W 157th St
- 15702 Dearborn St
- 15705 Dearborn St
- 15627 Beverly St
- 5905 W 157th St
- 15631 Beverly St
- 15635 Beverly St
- 5815 W 157th St
- 5901 W 157th St