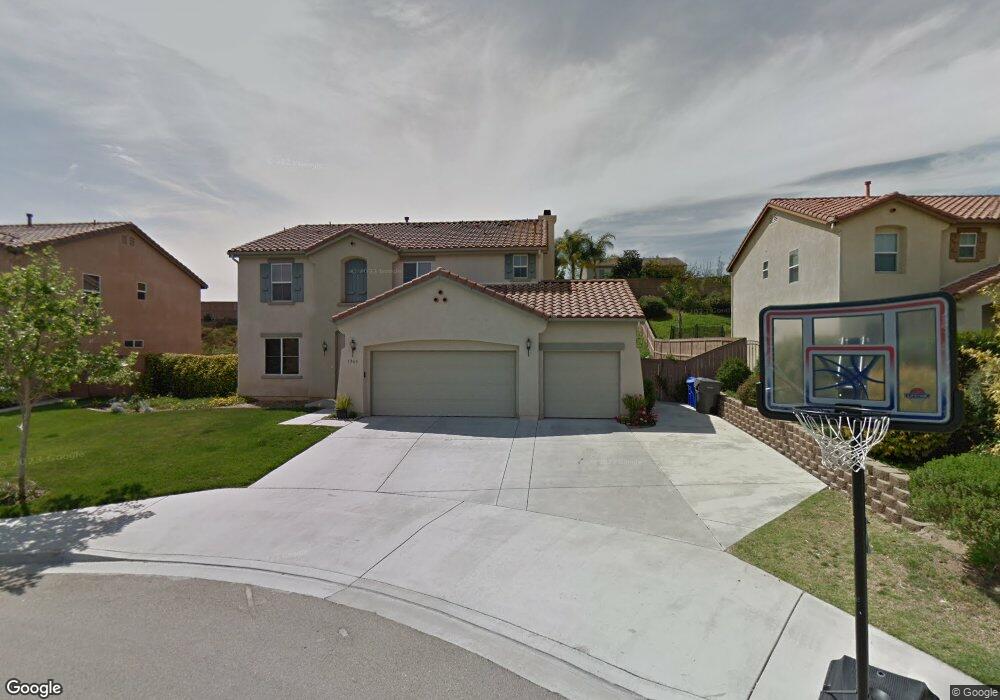
1563 Paulann Ct Fallbrook, CA 92028
Estimated Value: $847,000 - $896,000
4
Beds
3
Baths
2,459
Sq Ft
$352/Sq Ft
Est. Value
About This Home
This home is located at 1563 Paulann Ct, Fallbrook, CA 92028 and is currently estimated at $866,330, approximately $352 per square foot. 1563 Paulann Ct is a home located in San Diego County with nearby schools including La Paloma Elementary School, James E. Potter Intermediate School, and Fallbrook High School.
Ownership History
Date
Name
Owned For
Owner Type
Purchase Details
Closed on
Mar 23, 2015
Sold by
Kesler Catalina E
Bought by
Herbert Jeremy David and Herbert Kirstin M
Current Estimated Value
Home Financials for this Owner
Home Financials are based on the most recent Mortgage that was taken out on this home.
Original Mortgage
$405,695
Outstanding Balance
$310,951
Interest Rate
3.7%
Mortgage Type
VA
Estimated Equity
$555,379
Purchase Details
Closed on
Apr 18, 2011
Sold by
Kesler Catalina E
Bought by
Kesler Catalina E
Create a Home Valuation Report for This Property
The Home Valuation Report is an in-depth analysis detailing your home's value as well as a comparison with similar homes in the area
Home Values in the Area
Average Home Value in this Area
Purchase History
| Date | Buyer | Sale Price | Title Company |
|---|---|---|---|
| Herbert Jeremy David | $438,000 | Fidelity National Title | |
| Kesler Catalina E | -- | None Available |
Source: Public Records
Mortgage History
| Date | Status | Borrower | Loan Amount |
|---|---|---|---|
| Open | Herbert Jeremy David | $405,695 |
Source: Public Records
Tax History
| Year | Tax Paid | Tax Assessment Tax Assessment Total Assessment is a certain percentage of the fair market value that is determined by local assessors to be the total taxable value of land and additions on the property. | Land | Improvement |
|---|---|---|---|---|
| 2025 | $3,727 | $526,037 | $158,953 | $367,084 |
| 2024 | $3,727 | $515,724 | $155,837 | $359,887 |
| 2023 | $3,678 | $505,613 | $152,782 | $352,831 |
| 2022 | $3,765 | $495,700 | $149,787 | $345,913 |
| 2021 | $5,131 | $485,981 | $146,850 | $339,131 |
| 2020 | $5,173 | $480,999 | $145,345 | $335,654 |
| 2019 | $5,072 | $471,569 | $142,496 | $329,073 |
| 2018 | $5,071 | $462,323 | $139,702 | $322,621 |
| 2017 | $4,971 | $453,259 | $136,963 | $316,296 |
| 2016 | $4,847 | $444,373 | $134,278 | $310,095 |
| 2015 | $5,005 | $460,000 | $139,000 | $321,000 |
| 2014 | -- | $460,000 | $139,000 | $321,000 |
Source: Public Records
Map
Nearby Homes
- 206 Via Oro Verde
- 0 Laurine Ln
- 1735 S Mission Rd
- 0 Mission Rd Unit None
- 0 Mission Rd Unit NDP2602506
- 0 Mission Rd Unit IG25148608
- 0 Mission Rd Unit NDP2506959
- 929 Pepper Tree Ln
- 1024 Kiel Rd
- 1304 Farrand Rd
- 1003 Via Unidos
- 190 Mission Oaks Rd
- 445 Poets Square
- 1027 Pepper Tree Ln
- 710 Greyfield Ct
- 721 Highland Park
- 903 Crescent Bend
- 956 Woodcreek Rd
- 1455 Alturas Rd Unit 46
- 1455 Alturas Rd Unit 89
- 1555 Paulann Ct
- 1571 Paulann Ct
- 1566 Emerald Ridge Rd
- 1554 Emerald Ridge Rd
- 1539 Paulann Ct
- 1582 Emerald Ridge Rd
- 1538 Emerald Ridge Rd
- 1531 Paulann Ct
- 1570 Paulann Ct
- 1562 Paulann Ct
- 410 Palomino Rd
- 1554 Paulann Ct
- 1590 Emerald Ridge Rd
- 1522 Emerald Ridge Rd
- 1546 Paulann Ct
- 420 Palomino Rd
- 1538 Paulann Ct
- 1557 Emerald Ridge Rd
- 1549 Emerald Ridge Rd
- 1565 Emerald Ridge Rd
Your Personal Tour Guide
Ask me questions while you tour the home.