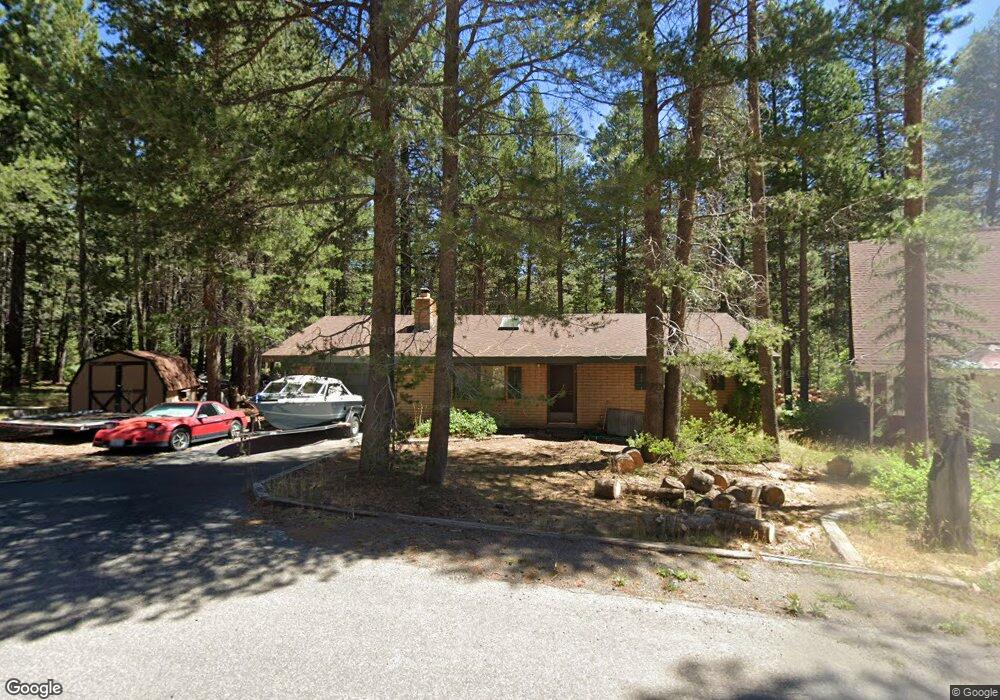
1563 Player Dr South Lake Tahoe, CA 96150
Estimated Value: $423,770 - $530,000
2
Beds
1
Bath
936
Sq Ft
$530/Sq Ft
Est. Value
About This Home
This home is located at 1563 Player Dr, South Lake Tahoe, CA 96150 and is currently estimated at $495,943, approximately $529 per square foot. 1563 Player Dr is a home located in El Dorado County with nearby schools including Sierra House Elementary School, South Tahoe Middle School, and South Tahoe High School.
Ownership History
Date
Name
Owned For
Owner Type
Purchase Details
Closed on
Aug 23, 2024
Sold by
Colford David B and Colford Catherine A
Bought by
David Colford And Catherine Colford Trust and Colford
Current Estimated Value
Purchase Details
Closed on
Jun 26, 2017
Sold by
Colford David B
Bought by
Colford David B and Colford Catherine A
Home Financials for this Owner
Home Financials are based on the most recent Mortgage that was taken out on this home.
Original Mortgage
$240,000
Interest Rate
3.89%
Mortgage Type
New Conventional
Purchase Details
Closed on
Feb 25, 1999
Sold by
Munn Robert L and Munn Katarina
Bought by
Colford David B
Home Financials for this Owner
Home Financials are based on the most recent Mortgage that was taken out on this home.
Original Mortgage
$99,500
Interest Rate
6.76%
Create a Home Valuation Report for This Property
The Home Valuation Report is an in-depth analysis detailing your home's value as well as a comparison with similar homes in the area
Home Values in the Area
Average Home Value in this Area
Purchase History
| Date | Buyer | Sale Price | Title Company |
|---|---|---|---|
| David Colford And Catherine Colford Trust | -- | None Listed On Document | |
| Colford David B | -- | Chicago Title Company | |
| Colford David B | $129,500 | Fidelity National Title Co |
Source: Public Records
Mortgage History
| Date | Status | Borrower | Loan Amount |
|---|---|---|---|
| Previous Owner | Colford David B | $240,000 | |
| Previous Owner | Colford David B | $99,500 |
Source: Public Records
Tax History Compared to Growth
Tax History
| Year | Tax Paid | Tax Assessment Tax Assessment Total Assessment is a certain percentage of the fair market value that is determined by local assessors to be the total taxable value of land and additions on the property. | Land | Improvement |
|---|---|---|---|---|
| 2025 | $2,000 | $188,095 | $47,016 | $141,079 |
| 2024 | $2,000 | $184,408 | $46,095 | $138,313 |
| 2023 | $1,965 | $180,793 | $45,192 | $135,601 |
| 2022 | $1,944 | $177,249 | $44,306 | $132,943 |
| 2021 | $1,911 | $173,775 | $43,438 | $130,337 |
| 2020 | $1,886 | $171,994 | $42,993 | $129,001 |
| 2019 | $1,876 | $168,622 | $42,150 | $126,472 |
| 2018 | $1,834 | $165,317 | $41,324 | $123,993 |
| 2017 | $1,805 | $162,076 | $40,514 | $121,562 |
| 2016 | $1,768 | $158,899 | $39,720 | $119,179 |
| 2015 | $1,678 | $156,514 | $39,124 | $117,390 |
| 2014 | $1,678 | $153,450 | $38,358 | $115,092 |
Source: Public Records
Map
Nearby Homes
- 1575 Crystal Air Dr
- 1579 Crystal Air Dr
- 1428 Skyline Dr
- 1578 Skyline Dr
- 1678 Tionontati St
- 1644 Crystal Air Dr
- 1713 Tionontati St
- 1671 Crystal Air Dr
- 1617 Cree St
- 1589 Cree St
- 1656 Oglala St
- 1580 Boca Raton Dr
- 1513 Cree St
- 1318 Pine Valley Rd
- 1670 Canienaga St
- 1567 Ojibwa St
- 1442 Vanderhoof Rd
- 1594 Canienaga St
- 1431 Vanderhoof Rd
- 1623 Hekpa Dr
- 1565 Player Dr
- 1560 Player Dr
- 1573 Player Dr
- 1570 Player Dr
- 1553 Player Dr
- 1577 Player Dr
- 1580 Player Dr
- 1541 Tionontati St
- 1535 Tionontati St
- 1545 Tionontati St
- 1551 Tionontati St
- 1527 Tionontati St
- 1531 Tionontati St
- 1546 Tionontati St
- 1534 Tionontati St
- 1590 Player Dr
- 1509 Tionontati St
- 1548 Tionontati St
- 1528 Tionontati St
- 1571 Tionontati St