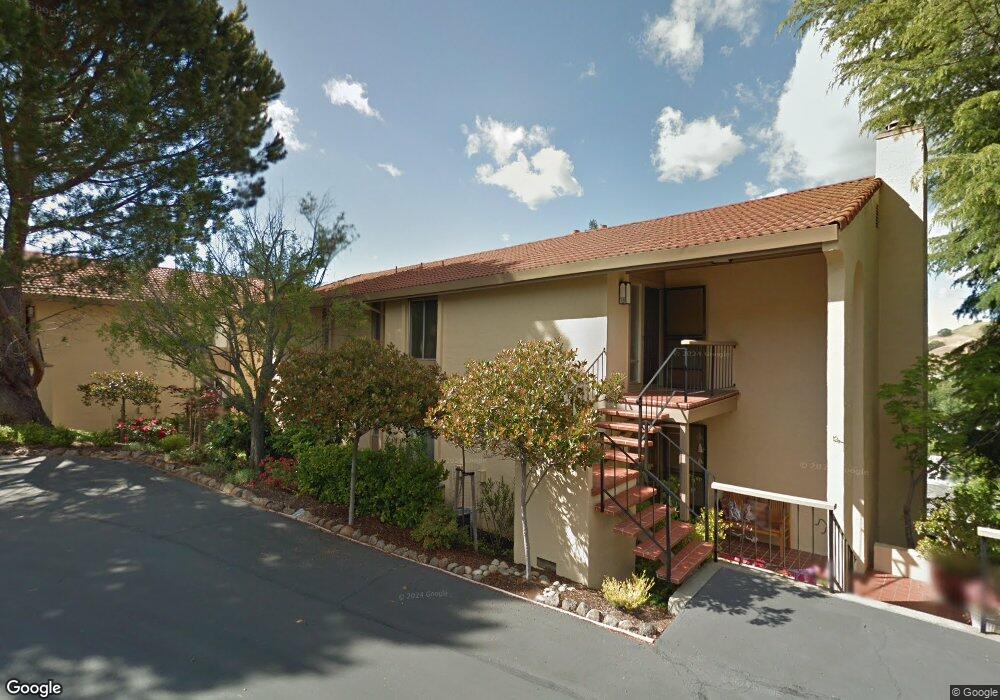
1563 Ptarmigan Dr Unit 1A Walnut Creek, CA 94595
Rossmoor NeighborhoodEstimated Value: $823,000 - $973,000
3
Beds
2
Baths
1,671
Sq Ft
$536/Sq Ft
Est. Value
About This Home
This home is located at 1563 Ptarmigan Dr Unit 1A, Walnut Creek, CA 94595 and is currently estimated at $896,302, approximately $536 per square foot. 1563 Ptarmigan Dr Unit 1A is a home located in Contra Costa County with nearby schools including Parkmead Elementary School, Walnut Creek Intermediate School, and Las Lomas High School.
Ownership History
Date
Name
Owned For
Owner Type
Purchase Details
Closed on
Jul 22, 2019
Sold by
Felix John William and Adams Janie Felix
Bought by
Eige Howard A and Eige Sharon
Current Estimated Value
Home Financials for this Owner
Home Financials are based on the most recent Mortgage that was taken out on this home.
Original Mortgage
$656,000
Outstanding Balance
$574,715
Interest Rate
3.82%
Mortgage Type
New Conventional
Estimated Equity
$321,587
Purchase Details
Closed on
Feb 28, 2003
Sold by
Felix Jane Arden
Bought by
Felix Jane Arden
Purchase Details
Closed on
Dec 20, 1996
Sold by
Levine Velda D and Levine Gary A
Bought by
Felix Jane Arden
Purchase Details
Closed on
Mar 27, 1995
Sold by
Levine Velda D
Bought by
Levine Velda D and Levine Gary A
Create a Home Valuation Report for This Property
The Home Valuation Report is an in-depth analysis detailing your home's value as well as a comparison with similar homes in the area
Home Values in the Area
Average Home Value in this Area
Purchase History
| Date | Buyer | Sale Price | Title Company |
|---|---|---|---|
| Eige Howard A | $820,000 | North American Title Co Inc | |
| Felix Jane Arden | -- | -- | |
| Felix Jane Arden | $259,000 | North American Title Co | |
| Levine Velda D | -- | -- |
Source: Public Records
Mortgage History
| Date | Status | Borrower | Loan Amount |
|---|---|---|---|
| Open | Eige Howard A | $656,000 |
Source: Public Records
Tax History Compared to Growth
Tax History
| Year | Tax Paid | Tax Assessment Tax Assessment Total Assessment is a certain percentage of the fair market value that is determined by local assessors to be the total taxable value of land and additions on the property. | Land | Improvement |
|---|---|---|---|---|
| 2025 | $10,551 | $883,661 | $492,139 | $391,522 |
| 2024 | $10,300 | $866,336 | $482,490 | $383,846 |
| 2023 | $10,300 | $849,350 | $473,030 | $376,320 |
| 2022 | $10,114 | $832,697 | $463,755 | $368,942 |
| 2021 | $9,840 | $816,370 | $454,662 | $361,708 |
| 2019 | $4,992 | $369,810 | $145,994 | $223,816 |
| 2018 | $4,837 | $362,560 | $143,132 | $219,428 |
| 2017 | $4,737 | $355,452 | $140,326 | $215,126 |
| 2016 | $4,636 | $348,483 | $137,575 | $210,908 |
| 2015 | $4,530 | $343,249 | $135,509 | $207,740 |
| 2014 | $4,472 | $336,526 | $132,855 | $203,671 |
Source: Public Records
Map
Nearby Homes
- 1405 Ptarmigan Dr Unit 1
- 1413 Ptarmigan Dr Unit 3
- 1129 Ptarmigan Dr Unit 3
- 1621 Ptarmigan Dr Unit 3C
- 1425 Canyonwood Ct
- 3152 Tice Creek Dr Unit 1
- 1501 Canyonwood Ct Unit 12
- 3100 Terra Granada Dr Unit 2
- 3128 Tice Creek Dr Unit 4
- 3395 Tice Creek Dr Unit 2
- 1932 Ptarmigan Dr Unit 3
- 1932 Ptarmigan Dr Unit 1
- 1416 Canyonwood Ct Unit 4
- 1150 Canyonwood Ct Unit 4
- 1424 Canyonwood Ct Unit 1
- 3244 Terra Granada Dr Unit 1B
- 1332 Canyonwood Ct Unit 2
- 1224 Canyonwood Ct Unit 2
- 1345 Singingwood Ct Unit 5
- 1125 Singingwood Ct Unit 4
- 1563 Ptarmigan Dr Unit 1B
- 1559 Ptarmigan Dr Unit 1B
- 1559 Ptarmigan Dr Unit 1A
- 1501 Ptarmigan Dr Unit 9C
- 1501 Ptarmigan Dr Unit 3C
- 1501 Ptarmigan Dr Unit 9A
- 1501 Ptarmigan Dr Unit 8A
- 1501 Ptarmigan Dr Unit 7A
- 1501 Ptarmigan Dr Unit 6A
- 1501 Ptarmigan Dr Unit 5A
- 1501 Ptarmigan Dr Unit 4A
- 1501 Ptarmigan Dr Unit 3A
- 1501 Ptarmigan Dr Unit 1A
- 1501 Ptarmigan Dr Unit 7C
- 1501 Ptarmigan Dr Unit 5C
- 1501 Ptarmigan Dr Unit 4C
- 1501 Ptarmigan Dr Unit 3C
- 1501 Ptarmigan Dr Unit 2C
- 1501 Ptarmigan Dr Unit 1C
- 1501 Ptarmigan Dr Unit 9B