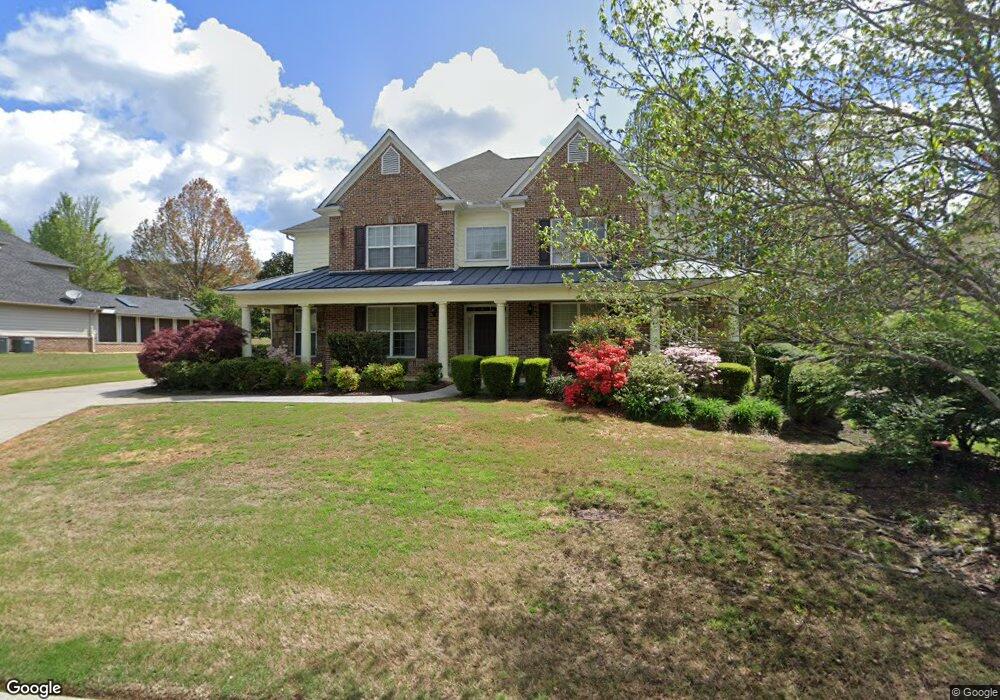
1563 Sage Ridge Dr Marietta, GA 30064
West Cobb NeighborhoodEstimated Value: $567,918 - $655,000
5
Beds
4
Baths
3,770
Sq Ft
$166/Sq Ft
Est. Value
About This Home
This home is located at 1563 Sage Ridge Dr, Marietta, GA 30064 and is currently estimated at $626,480, approximately $166 per square foot. 1563 Sage Ridge Dr is a home located in Cobb County with nearby schools including Dowell Elementary School, Lovinggood Middle School, and Hillgrove High School.
Ownership History
Date
Name
Owned For
Owner Type
Purchase Details
Closed on
Jul 24, 2009
Sold by
National Rsndtl Nominee Svcs I
Bought by
Yamashita Hideto
Current Estimated Value
Home Financials for this Owner
Home Financials are based on the most recent Mortgage that was taken out on this home.
Original Mortgage
$210,000
Outstanding Balance
$137,477
Interest Rate
5.37%
Mortgage Type
New Conventional
Estimated Equity
$489,003
Purchase Details
Closed on
Jun 26, 2007
Sold by
Wigley Henry H and Wigley Kay M
Bought by
Moore William T
Home Financials for this Owner
Home Financials are based on the most recent Mortgage that was taken out on this home.
Original Mortgage
$73,600
Interest Rate
6.37%
Mortgage Type
Stand Alone Refi Refinance Of Original Loan
Purchase Details
Closed on
Jan 22, 2007
Sold by
Wigley Henry H
Bought by
Wigley Henry H and Wigley Kay M
Purchase Details
Closed on
Aug 26, 2005
Sold by
Venture Homes Inc
Bought by
Wigley Henry Hy and Wigley Kay
Create a Home Valuation Report for This Property
The Home Valuation Report is an in-depth analysis detailing your home's value as well as a comparison with similar homes in the area
Home Values in the Area
Average Home Value in this Area
Purchase History
| Date | Buyer | Sale Price | Title Company |
|---|---|---|---|
| Yamashita Hideto | $300,000 | -- | |
| National Resndtl Nominee Svcs | $300,000 | -- | |
| Moore William T | $368,000 | -- | |
| Wigley Henry H | -- | -- | |
| Wigley Henry Hy | $350,000 | -- |
Source: Public Records
Mortgage History
| Date | Status | Borrower | Loan Amount |
|---|---|---|---|
| Open | National Resndtl Nominee Svcs | $210,000 | |
| Previous Owner | Moore William T | $73,600 |
Source: Public Records
Tax History Compared to Growth
Tax History
| Year | Tax Paid | Tax Assessment Tax Assessment Total Assessment is a certain percentage of the fair market value that is determined by local assessors to be the total taxable value of land and additions on the property. | Land | Improvement |
|---|---|---|---|---|
| 2024 | $1,580 | $193,900 | $28,000 | $165,900 |
| 2023 | $1,374 | $193,900 | $28,000 | $165,900 |
| 2022 | $1,580 | $193,900 | $28,000 | $165,900 |
| 2021 | $1,459 | $153,472 | $28,000 | $125,472 |
| 2020 | $4,171 | $153,472 | $28,000 | $125,472 |
| 2019 | $4,171 | $153,472 | $28,000 | $125,472 |
| 2018 | $4,234 | $156,384 | $26,000 | $130,384 |
| 2017 | $3,655 | $138,456 | $26,000 | $112,456 |
| 2016 | $3,657 | $138,456 | $26,000 | $112,456 |
| 2015 | $3,778 | $128,228 | $19,200 | $109,028 |
| 2014 | $2,936 | $98,820 | $0 | $0 |
Source: Public Records
Map
Nearby Homes
- 1518 Sage Ridge Dr
- 1234 Wynford Colony SW
- 3006 Coffman Ct SW
- 2866 Wynford Dr SW Unit 2
- 3001 Ashland Ct SW
- 1567 Vine Leaf Dr
- 1765 Dew Place
- 2673 Altony Dr SW
- 1237 Wynford Woods SW
- 3354 Hannah Ct
- 1884 Dovonshire Rd SW
- 1209 Wilkes Way SW Unit 1
- 1311 Bustling Ln SW
- 1313 Bustling Ln SW
- 1853 Edington Rd SW
- 3416 N Cook Rd
- 2418 Southern Oak Dr SW
- 1204 Commonwealth Ave SW
- 1004 Villa Rica Rd SW
- 1567 Sage Ridge Dr
- 1551 Sage Ridge Dr
- 1539 Sage Ridge Dr
- 1571 Sage Ridge Dr
- 1519 Sage Ridge Dr
- 1515 Sage Ridge Dr
- 1570 Sage Ridge Dr
- 1511 Sage Ridge Dr
- 1575 Sage Ridge Dr
- 0 Sage Ridge Dr Unit 8546286
- 0 Sage Ridge Dr Unit 8182986
- 0 Sage Ridge Dr Unit 8077165
- 0 Sage Ridge Dr Unit 8007728
- 0 Sage Ridge Dr Unit 8007730
- 0 Sage Ridge Dr Unit 8764780
- 0 Sage Ridge Dr Unit 8896683
- 0 Sage Ridge Dr Unit 8921273
- 0 Sage Ridge Dr Unit 7060052
- 0 Sage Ridge Dr Unit 7092628
- 0 Sage Ridge Dr Unit 7397057