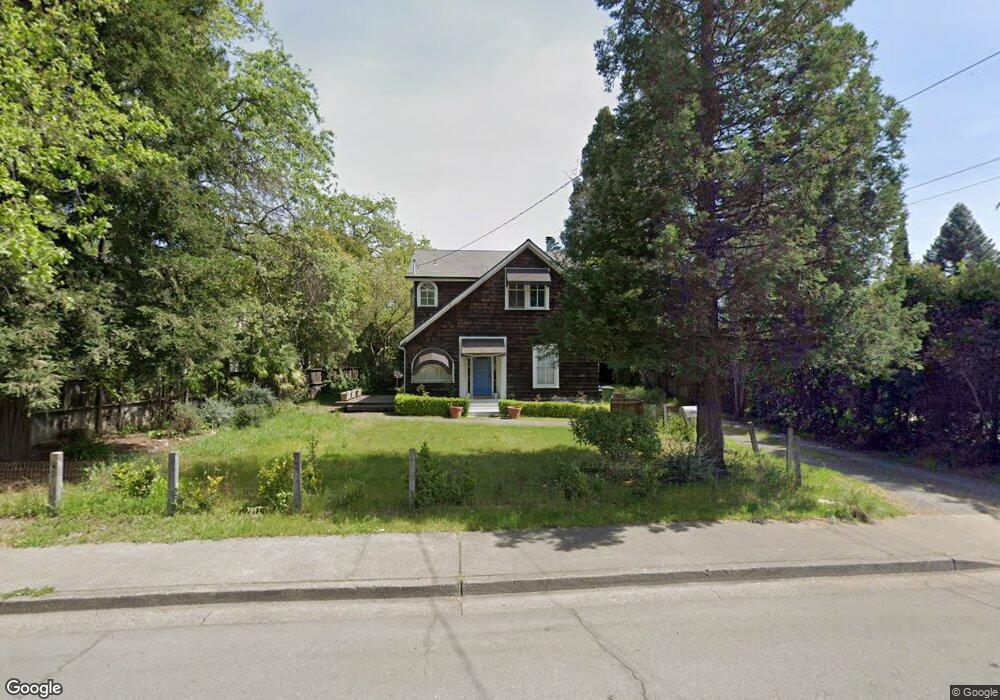
1563 Spring St Saint Helena, CA 94574
Estimated Value: $1,919,504 - $2,793,000
3
Beds
2
Baths
2,416
Sq Ft
$961/Sq Ft
Est. Value
About This Home
This home is located at 1563 Spring St, Saint Helena, CA 94574 and is currently estimated at $2,321,376, approximately $960 per square foot. 1563 Spring St is a home located in Napa County with nearby schools including Saint Helena Elementary School, Saint Helena Primary School, and Robert Louis Stevenson Intermediate School.
Ownership History
Date
Name
Owned For
Owner Type
Purchase Details
Closed on
Jun 22, 2022
Sold by
Howell Christopher B and Howell Kathryn B
Bought by
Howell-Lazartrust
Current Estimated Value
Purchase Details
Closed on
Jun 10, 2003
Sold by
Lazar Kathryn B and Sinnes Kathryn B Lazar
Bought by
Howell Christopher and Lazar Kathryn B
Home Financials for this Owner
Home Financials are based on the most recent Mortgage that was taken out on this home.
Original Mortgage
$460,000
Interest Rate
5.53%
Mortgage Type
Purchase Money Mortgage
Purchase Details
Closed on
Aug 3, 1995
Sold by
Sinnes A Cort
Bought by
Sinnes Kathryn B Lazar
Purchase Details
Closed on
Jul 1, 1993
Sold by
Marquart Fred
Bought by
Sinnes A Cort and Lazar Sinnes Kathryn B
Home Financials for this Owner
Home Financials are based on the most recent Mortgage that was taken out on this home.
Original Mortgage
$500,000
Interest Rate
7.5%
Mortgage Type
Seller Take Back
Create a Home Valuation Report for This Property
The Home Valuation Report is an in-depth analysis detailing your home's value as well as a comparison with similar homes in the area
Home Values in the Area
Average Home Value in this Area
Purchase History
| Date | Buyer | Sale Price | Title Company |
|---|---|---|---|
| Howell-Lazartrust | -- | None Listed On Document | |
| Howell Christopher | -- | First American Title Co Napa | |
| Sinnes Kathryn B Lazar | -- | Fidelity National Title | |
| Sinnes A Cort | $530,000 | Fidelity National Title |
Source: Public Records
Mortgage History
| Date | Status | Borrower | Loan Amount |
|---|---|---|---|
| Previous Owner | Howell Christopher | $460,000 | |
| Previous Owner | Sinnes A Cort | $500,000 |
Source: Public Records
Tax History Compared to Growth
Tax History
| Year | Tax Paid | Tax Assessment Tax Assessment Total Assessment is a certain percentage of the fair market value that is determined by local assessors to be the total taxable value of land and additions on the property. | Land | Improvement |
|---|---|---|---|---|
| 2025 | $9,370 | $900,805 | $404,511 | $496,294 |
| 2024 | $9,370 | $883,143 | $396,580 | $486,563 |
| 2023 | $9,370 | $865,827 | $388,804 | $477,023 |
| 2022 | $8,898 | $848,851 | $381,181 | $467,670 |
| 2021 | $8,779 | $832,207 | $373,707 | $458,500 |
| 2020 | $8,690 | $823,675 | $369,876 | $453,799 |
| 2019 | $8,538 | $807,525 | $362,624 | $444,901 |
| 2018 | $8,399 | $791,692 | $355,514 | $436,178 |
| 2017 | $8,241 | $776,170 | $348,544 | $427,626 |
| 2016 | $8,057 | $760,952 | $341,710 | $419,242 |
| 2015 | $7,994 | $749,523 | $336,578 | $412,945 |
| 2014 | $7,917 | $734,841 | $329,985 | $404,856 |
Source: Public Records
Map
Nearby Homes
- 1209 Stockton St
- 1243 Stockton St
- 1551 Spring St
- 1664 Spring St
- 1711 Tainter St
- 1711 Spring St
- 1503 Tainter St
- 1430 Wallis Ct
- 1233 Kearney St
- 1777 Adams St
- 1430 Stockton St
- 1133 Oak Ave
- 1123 Oak Ave
- 1191 Hudson Ave
- 1149 Hudson Ave
- 1467 Kearney St
- 1540 Allyn Ave
- 2060 Olive Ave
- 0 Spring St
- 1547 Allyn Ave
- 1635 Spring St
- 1531 Spring St
- 1515 Spring St
- 1556 Spring St
- 1523 Spring St
- 1542 Spring St
- 1213 Stockton St
- 1626 Spring St
- 1219 Stockton St
- 1505 Spring St
- 1526 Spring St
- 1640 Spring St
- 1230 Stockton St
- 1530 Voorhees Cir
- 1528 Voorhees Cir
- 1534 Voorhees Cir
- 1227 Stockton St
- 1524 Voorhees Cir
- 1451 Spring St