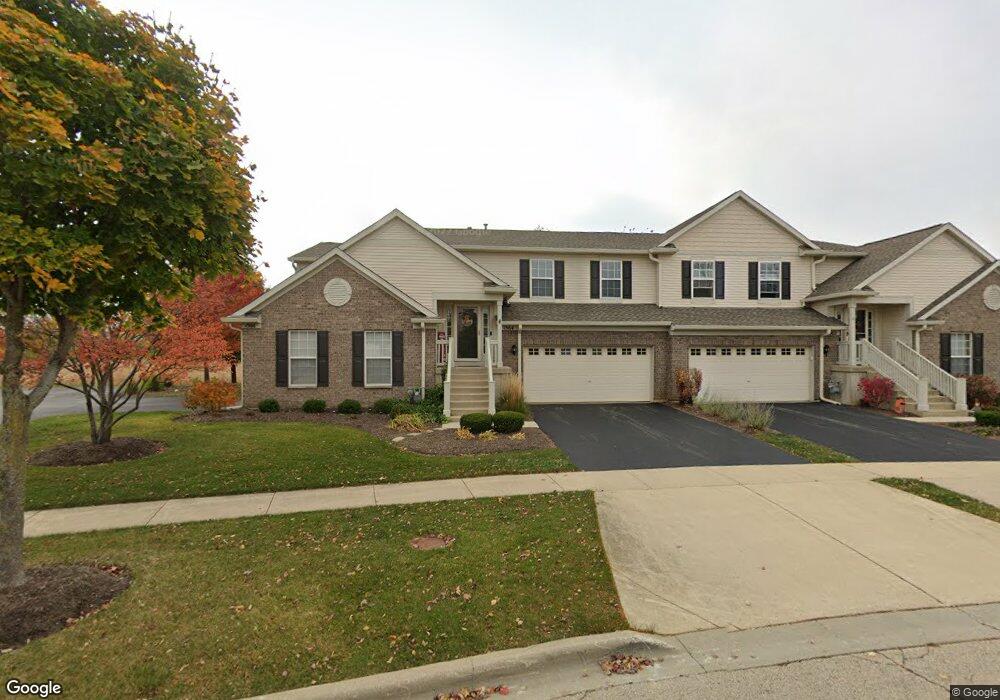
1564 Matthew Dr Unit 392 Algonquin, IL 60102
Far West Algonquin NeighborhoodEstimated Value: $282,845 - $307,000
2
Beds
--
Bath
1,861
Sq Ft
$158/Sq Ft
Est. Value
About This Home
This home is located at 1564 Matthew Dr Unit 392, Algonquin, IL 60102 and is currently estimated at $294,211, approximately $158 per square foot. 1564 Matthew Dr Unit 392 is a home located in Kane County with nearby schools including Westfield Community School, Lincoln Prairie Elementary School, and Harry D Jacobs High School.
Ownership History
Date
Name
Owned For
Owner Type
Purchase Details
Closed on
Dec 15, 2023
Sold by
Kelley Joseph P and Kelley Elizabeth A
Bought by
Kelley Living Trust and Kelley
Current Estimated Value
Purchase Details
Closed on
Aug 21, 2020
Sold by
Kerr Daniel
Bought by
Kelley Joseph
Home Financials for this Owner
Home Financials are based on the most recent Mortgage that was taken out on this home.
Original Mortgage
$160,000
Interest Rate
2.9%
Mortgage Type
New Conventional
Purchase Details
Closed on
Sep 1, 2005
Sold by
Centex Homes
Bought by
Kerr Daniel
Home Financials for this Owner
Home Financials are based on the most recent Mortgage that was taken out on this home.
Original Mortgage
$192,056
Interest Rate
6.12%
Mortgage Type
Fannie Mae Freddie Mac
Create a Home Valuation Report for This Property
The Home Valuation Report is an in-depth analysis detailing your home's value as well as a comparison with similar homes in the area
Home Values in the Area
Average Home Value in this Area
Purchase History
| Date | Buyer | Sale Price | Title Company |
|---|---|---|---|
| Kelley Living Trust | -- | None Listed On Document | |
| Kelley Joseph | $200,000 | Old Republic Title | |
| Kerr Daniel | $240,500 | Chicago Title Insurance Comp |
Source: Public Records
Mortgage History
| Date | Status | Borrower | Loan Amount |
|---|---|---|---|
| Previous Owner | Kelley Joseph | $160,000 | |
| Previous Owner | Kerr Daniel | $192,056 |
Source: Public Records
Tax History Compared to Growth
Tax History
| Year | Tax Paid | Tax Assessment Tax Assessment Total Assessment is a certain percentage of the fair market value that is determined by local assessors to be the total taxable value of land and additions on the property. | Land | Improvement |
|---|---|---|---|---|
| 2024 | $5,277 | $77,403 | $8,371 | $69,032 |
| 2023 | $5,017 | $69,645 | $7,532 | $62,113 |
| 2022 | $5,181 | $67,990 | $7,532 | $60,458 |
| 2021 | $5,018 | $64,196 | $7,112 | $57,084 |
| 2020 | $5,436 | $62,753 | $6,952 | $55,801 |
| 2019 | $5,289 | $59,572 | $6,600 | $52,972 |
| 2018 | $4,408 | $53,812 | $6,469 | $47,343 |
| 2017 | $4,215 | $50,338 | $6,051 | $44,287 |
| 2016 | $4,315 | $48,740 | $5,859 | $42,881 |
| 2015 | -- | $42,573 | $5,490 | $37,083 |
| 2014 | -- | $41,397 | $5,338 | $36,059 |
| 2013 | -- | $42,664 | $5,501 | $37,163 |
Source: Public Records
Map
Nearby Homes
- 0 Boyer Rd Unit MRD11328255
- 2930 Harnish Dr
- 2601 Harnish Dr
- 2611 Harnish Dr
- 000 County Line Rd
- DOVER Plan at Grand Reserve - Algonquin
- CLIFTON Plan at Grand Reserve - Algonquin
- 30 Arbordale Ct Unit 4284
- 2660 Harnish Dr
- 2043 Peach Tree Ln Unit 4122
- Marianne Plan at Algonquin Meadows - Traditional Townhomes
- Darcy Plan at Algonquin Meadows - Traditional Townhomes
- Charlotte Plan at Algonquin Meadows - Traditional Townhomes
- 1900 Waverly Ln
- 1801 Arbordale Ln
- Amherst Plan at Algonquin Meadows - Urban Townhomes
- Chatham Plan at Algonquin Meadows - Urban Townhomes
- Chelsea Plan at Algonquin Meadows - Urban Townhomes
- 1020 Glenmont St
- 1264 Glenmont St
- 1564 Matthew Dr Unit 1564
- 1566 Matthew Dr Unit 391
- 1562 Matthew Dr Unit 3
- 1560 Matthew Dr Unit 394
- 2616 Amber Ln Unit 2616
- 2633 Amber Ln Unit 2633
- 1561 Matthew Dr Unit 1
- 1584 Millbrook Dr Unit 2
- 1557 Matthew Dr Unit 4
- 2622 Amber Ln Unit 423
- 2603 Amber Ln Unit 2
- 1582 Millbrook Dr Unit 3
- 2621 Loren Ln Unit 451
- 2610 Amber Ln Unit 4
- 2613 Loren Ln Unit 4602
- 2627 Loren Ln Unit 454
- 1574 Millbrook Dr Unit 1
- 2635 Amber Ln Unit 3
- 1580 Millbrook Dr Unit 4