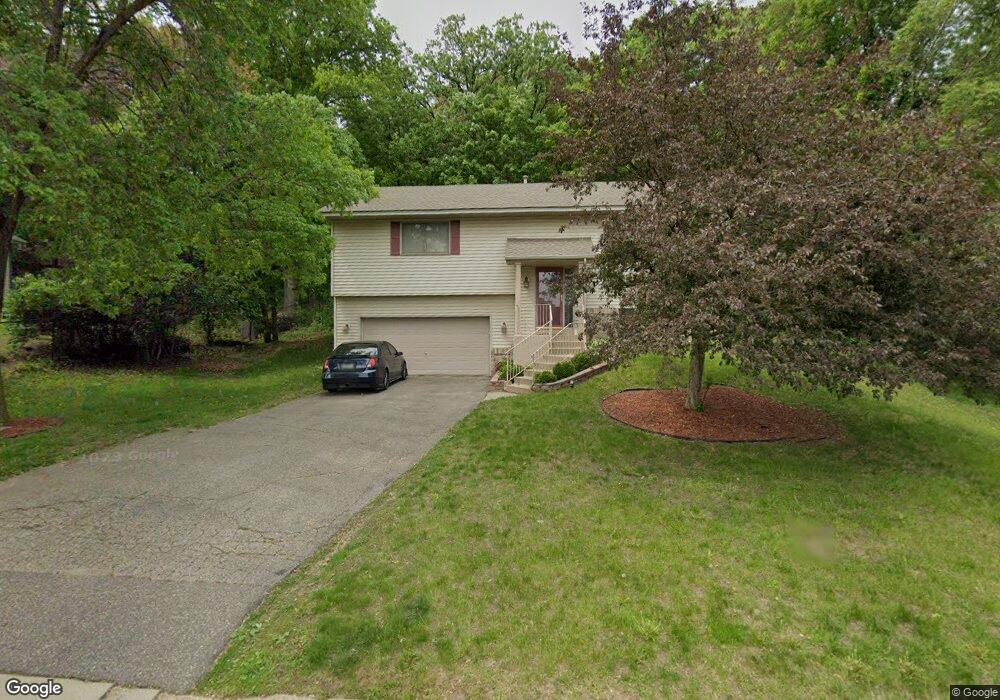
15640 Alpine Cir Burnsville, MN 55306
Estimated Value: $368,000 - $403,506
2
Beds
2
Baths
1,620
Sq Ft
$240/Sq Ft
Est. Value
About This Home
This home is located at 15640 Alpine Cir, Burnsville, MN 55306 and is currently estimated at $388,877, approximately $240 per square foot. 15640 Alpine Cir is a home located in Dakota County with nearby schools including Impact Academy at Orchard Lake Elementary School, Kenwood Trail Middle School, and Lakeville South High School.
Ownership History
Date
Name
Owned For
Owner Type
Purchase Details
Closed on
Mar 3, 2020
Sold by
Sph Property One Llc
Bought by
Babic Robert W and Babic Cheryl
Current Estimated Value
Home Financials for this Owner
Home Financials are based on the most recent Mortgage that was taken out on this home.
Original Mortgage
$269,660
Outstanding Balance
$238,822
Interest Rate
3.5%
Mortgage Type
New Conventional
Estimated Equity
$150,055
Purchase Details
Closed on
Oct 4, 2019
Sold by
Egle Alex J and Spitt Alissa M
Bought by
Sph Property One Llc
Purchase Details
Closed on
Jun 30, 2017
Sold by
Falling Lyle Herman and Falling Lavonne C
Bought by
Spitt Alissa M and Egle Alex J
Home Financials for this Owner
Home Financials are based on the most recent Mortgage that was taken out on this home.
Original Mortgage
$216,000
Interest Rate
3.95%
Mortgage Type
New Conventional
Create a Home Valuation Report for This Property
The Home Valuation Report is an in-depth analysis detailing your home's value as well as a comparison with similar homes in the area
Home Values in the Area
Average Home Value in this Area
Purchase History
| Date | Buyer | Sale Price | Title Company |
|---|---|---|---|
| Babic Robert W | $278,000 | Network Title Inc | |
| Sph Property One Llc | $276,000 | Network Title Inc | |
| Spitt Alissa M | $240,000 | None Available |
Source: Public Records
Mortgage History
| Date | Status | Borrower | Loan Amount |
|---|---|---|---|
| Open | Babic Robert W | $269,660 | |
| Previous Owner | Spitt Alissa M | $216,000 |
Source: Public Records
Tax History Compared to Growth
Tax History
| Year | Tax Paid | Tax Assessment Tax Assessment Total Assessment is a certain percentage of the fair market value that is determined by local assessors to be the total taxable value of land and additions on the property. | Land | Improvement |
|---|---|---|---|---|
| 2024 | $3,706 | $311,100 | $100,700 | $210,400 |
| 2023 | $3,706 | $310,500 | $90,900 | $219,600 |
| 2022 | $3,156 | $291,000 | $90,700 | $200,300 |
| 2021 | $2,984 | $257,800 | $78,900 | $178,900 |
| 2020 | $3,124 | $241,000 | $75,100 | $165,900 |
| 2019 | $2,827 | $224,251 | $66,836 | $157,415 |
| 2018 | $2,628 | $225,600 | $68,100 | $157,500 |
| 2017 | $2,526 | $209,700 | $64,900 | $144,800 |
| 2016 | $2,519 | $198,500 | $61,800 | $136,700 |
| 2015 | $2,422 | $171,277 | $53,720 | $117,557 |
| 2014 | -- | $174,220 | $52,895 | $121,325 |
| 2013 | -- | $157,434 | $47,512 | $109,922 |
Source: Public Records
Map
Nearby Homes
- 1005 Hilloway Cir
- 15712 Bryant Ave S
- 1105 W 158th St
- 1312 Fremont Ct
- 15455 Fremont Ave S
- 11285 163rd St W
- 15203 Greenhaven Way
- 594 Stonewood Ln
- 600 Greenhaven Dr Unit 213
- 900 Windemere Way
- 101 Oak Shore Dr
- 10435 163rd St W
- 15100 Eileen Cir
- 15250 Stevens Ave
- 15080 Buck Hill Rd
- XXXX Judicial Rd
- 16357 Java Ln
- 14815 County Road 5
- 313 Maple Island Rd
- 16720 Klamath Tl
- 15636 Alpine Cir
- 15700 Alpine Cir
- 15704 Alpine Cir
- 15632 Alpine Cir
- 1009 Hilloway Cir
- 15637 Alpine Cir
- 15701 Alpine Cir
- 1001 Hilloway Cir
- 15633 Alpine Cir
- 15628 Alpine Cir
- 15708 Alpine Cir
- 1013 Hilloway Cir
- 15705 Alpine Cir
- 15712 Alpine Cir
- 15700 Chalet Ct
- 15720 Alpine Cir
- 1000 Hilloway Cir
- 15624 Alpine Cir
- 1101 Hilloway Cir
- 1004 Hilloway Cir