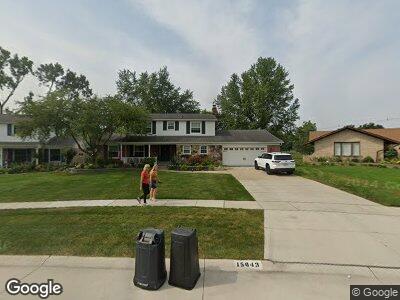
15643 Edgewood St Unit Bldg-Unit Livonia, MI 48154
Coventry Gardens NeighborhoodEstimated Value: $417,000 - $507,000
--
Bed
3
Baths
2,239
Sq Ft
$207/Sq Ft
Est. Value
About This Home
This home is located at 15643 Edgewood St Unit Bldg-Unit, Livonia, MI 48154 and is currently estimated at $464,465, approximately $207 per square foot. 15643 Edgewood St Unit Bldg-Unit is a home located in Wayne County with nearby schools including Buchanan Elementary School, Riley Upper Elementary School, and Holmes Middle School.
Ownership History
Date
Name
Owned For
Owner Type
Purchase Details
Closed on
Jan 20, 2021
Sold by
Kinney Jerad and Kinney Kelly
Bought by
Silsbee Ryan
Current Estimated Value
Home Financials for this Owner
Home Financials are based on the most recent Mortgage that was taken out on this home.
Original Mortgage
$340,000
Outstanding Balance
$310,321
Interest Rate
2.71%
Mortgage Type
New Conventional
Estimated Equity
$139,482
Purchase Details
Closed on
Jun 15, 2018
Sold by
Enger Wheeler Frederick R and Enger Wheeler Marilyn
Bought by
Kinney Jerad and Kinney Kelly
Home Financials for this Owner
Home Financials are based on the most recent Mortgage that was taken out on this home.
Original Mortgage
$299,250
Interest Rate
4.6%
Mortgage Type
New Conventional
Create a Home Valuation Report for This Property
The Home Valuation Report is an in-depth analysis detailing your home's value as well as a comparison with similar homes in the area
Home Values in the Area
Average Home Value in this Area
Purchase History
| Date | Buyer | Sale Price | Title Company |
|---|---|---|---|
| Silsbee Ryan | $400,000 | Stg | |
| Kinney Jerad | $315,000 | None Available |
Source: Public Records
Mortgage History
| Date | Status | Borrower | Loan Amount |
|---|---|---|---|
| Open | Silsbee Ryan | $60,000 | |
| Open | Silsbee Ryan | $340,000 | |
| Previous Owner | Kinney Jerad P | $288,000 | |
| Previous Owner | Kinney Jerad | $295,000 | |
| Previous Owner | Kinney Jerad P | $300,500 | |
| Previous Owner | Kenney Jerad | $301,500 | |
| Previous Owner | Kinney Jerad | $299,250 | |
| Previous Owner | Wheeler Frederick R | $37,000 |
Source: Public Records
Tax History Compared to Growth
Tax History
| Year | Tax Paid | Tax Assessment Tax Assessment Total Assessment is a certain percentage of the fair market value that is determined by local assessors to be the total taxable value of land and additions on the property. | Land | Improvement |
|---|---|---|---|---|
| 2024 | $4,214 | $202,700 | $0 | $0 |
| 2023 | $4,020 | $189,500 | $0 | $0 |
| 2022 | $7,059 | $172,900 | $0 | $0 |
| 2021 | $6,430 | $159,600 | $0 | $0 |
| 2019 | $6,169 | $151,900 | $0 | $0 |
| 2018 | $2,210 | $143,200 | $0 | $0 |
| 2017 | $5,748 | $138,800 | $0 | $0 |
| 2016 | $3,884 | $136,800 | $0 | $0 |
| 2015 | $9,402 | $116,790 | $0 | $0 |
| 2012 | -- | $95,510 | $20,400 | $75,110 |
Source: Public Records
Map
Nearby Homes
- 15643 Edgewood St
- 15072 Gary Ln
- 15330 Fairlane Dr
- 16159 Edgewood Dr
- 35512 Southampton St
- 16114 Alpine Dr
- 14879 Riverside St
- 14737 Country Club Dr
- 16444 Fairway St
- 16460 Golfview St
- 16508 Fairway St
- 33993 Dorais St
- 16229 Southampton St
- 34495 Wood St
- 34461 Wood St
- 15618 Surrey St
- 17305 Laurel Dr
- 17367 Ellen Dr
- 14475 Woodside Dr
- 16618 Surrey St
- 15643 Edgewood St Unit Bldg-Unit
- 15629 Edgewood St
- 15657 Edgewood St
- 15469 Ellen Dr
- 15611 Edgewood St
- 15671 Edgewood St
- 15644 Edgewood St
- 15467 Ellen Dr
- 15619 Ellen Dr
- 15685 Edgewood St
- 15682 Edgewood St
- 15635 Ellen Dr
- 35057 Roycroft St
- 15441 Ellen Dr
- 15699 Edgewood St
- 15472 Ellen Dr
- 15696 Edgewood St
- 15651 Ellen Dr
- 15450 Ellen Dr
- 35041 Roycroft St